
Page 252 - IJB-9-3
P. 252
International Journal of Bioprinting Multi-material bioprinting with OCT imaging
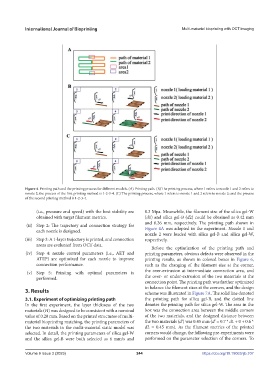
Figure 4. Printing path and the printing process for different models. (A) Printing path. (B) The printing process, where 1 refers to nozzle 1 and 2 refers to
nozzle 2; the process of the first printing method is 1-2-3-4. (C) The printing process, where 1 refers to nozzle 1 and 2 refers to nozzle 2; and the process
of the second printing method is 1-2-3-4.
(i.e., pressure and speed) with the best stability are 0.3 Mpa. Meanwhile, the filament size of the silica gel-W
obtained with target filament metrics. (d1) and silica gel-B (d2) could be obtained as 0.42 mm
(ii) Step 2: The trajectory and connection strategy for and 0.26 mm, respectively. The printing path shown in
each nozzle is designed. Figure 4A was adopted in the experiment. Nozzle 1 and
nozzle 2 were loaded with silica gel-B and silica gel-W,
(iii) Step 3: A 1-layer trajectory is printed, and connection respectively.
areas are evaluated from OCT data.
Before the optimization of the printing path and
(iv) Step 4: nozzle control parameters (i.e., AET and printing parameters, obvious defects were observed in the
ATEP) are optimized for each nozzle to improve printing results, as shown in colored boxes in Figure 6,
connection performance. such as the changing of the filament size at the corner,
(v) Step 5: Printing with optimal parameters is the over-extrusion at intermediate connection area, and
performed. the over- or under-extrusion of the two materials at the
connection point. The printing path was further optimized
to balance the filament sizes at the corners, and the design
3. Results scheme was illustrated in Figure 7A. The solid line denoted
3.1. Experiment of optimizing printing path the printing path for silica gel-B, and the dotted line
In the first experiment, the layer thickness of the two denotes the printing path for silica gel-W. The area in the
materials (H) was designed to be consistent with a nominal box was the connection area between the middle corners
value of 0.28 mm. Based on the printed structures of multi- of the two materials, and the designed distance between
material bioprinting matching, the printing parameters of the two materials (dʹ) was 0.45 mm (dʹ = 0.7 * d1 + 0 + 0.6 *
the two materials in the multi-material static model was d2 = 0.45 mm). As the filament metrics of the printed
selected. In detail, the printing parameters of silica gel-W corners would change, the following pre-experiments were
and the silica gel-B were both selected as 6 mm/s and performed on the parameter selection of the corners. To
Volume 9 Issue 3 (2023) 244 https://doi.org/10.18063/ijb.707