
Page 331 - IJB-9-3
P. 331
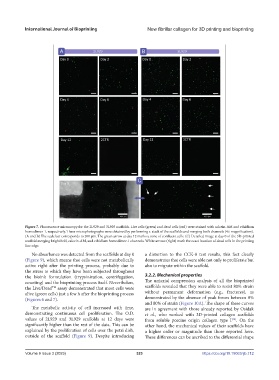
International Journal of Bioprinting                New fibrillar collagen for 3D printing and bioprinting


            Figure 7. Fluorescence microscopy for the 2L929 and 3L929 scaffolds. Live cells (green) and dead cells (red) were stained with calcein-AM and ethidium
            homodimer-1, respectively. These microphotographs were obtained by performing z-stack of the scaffolds and merging both channels (4× magnification).
            (A and B) The scale bar corresponds to 200 µm. The green arrow at day 12 marks a zone of confluent cells. (C) Detailed image at day 0 of the 3D-printed
            scaffold merging brightfield, calcein-AM, and ethidium homodimer-1 channels. White arrows (right) mark the exact location of dead cells in the printing
            line edge.
               No absorbance was detected from the scaffolds at day 0   a distortion to the CCK-8 test results, this fact clearly
            (Figure 9), which means that cells were not metabolically   demonstrates that cells were able not only to proliferate but
            active right after the printing process, probably due to   also to migrate within the scaffold.
            the stress to which they have been subjected throughout
            the bioink formulation (trypsinization, centrifugation,   3.2.2. Mechanical properties
            counting) and the bioprinting process itself. Nevertheless,   The uniaxial compression analysis of all the bioprinted
            the Live/Dead  assay demonstrated that most cells were   scaffolds revealed that they were able to resist 80% strain
                       TM
            alive (green cells) just a few h after the bioprinting process   without permanent deformation (e.g., fractures), as
            (Figures 6 and 7).                                 demonstrated by the absence of peak forces between 0%
                                                               and 80% of strain (Figure 10A). The shape of these curves
               The metabolic activity of cell increased with time,   are in agreement with those already reported by Osidak
            demonstrating  continuous  cell  proliferation.  The  O.D.   et al., who worked with 3D-printed collagen scaffolds
            values of 2L929 and 3L929 scaffolds at 12 days were   from soluble porcine origin collagen type I . On the
                                                                                                    [28]
            significantly higher than the rest of the data. This can be   other hand, the mechanical values of their scaffolds have
            explained by the proliferation of cells over the petri dish,   a higher order or magnitude than those reported here.
            outside of the scaffold (Figure 9). Despite introducing   These differences can be ascribed to the differential shape


            Volume 9 Issue 3 (2023)                        323                         https://doi.org/10.18063/ijb.712