
Page 40 - IJB-9-3
P. 40
International Journal of Bioprinting Comparison of different 3D printing technologies
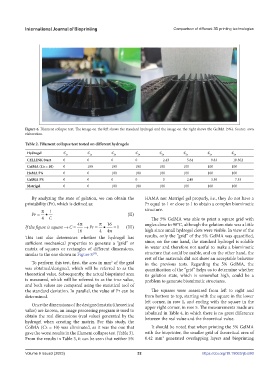
Figure 6. Filament collapse test. The image on the left shows the standard hydrogel and the image on the right shows the GelMA (5%). Source: own
elaboration.
Table 2. Filament collapse test tested on different hydrogels
Hydrogel C f 1 C f 2 C f 3 C f 4 C f 5 C f 6 C f 7 C f 8
CELLINK Start 0 0 0 0 2.43 5.64 9.83 10.302
ColMA (Cs = 10) 0 100 100 100 100 100 100 100
HaMA 5% 0 0 100 100 100 100 100 100
GelMA 5% 0 0 0 0 0 2.49 3.59 7.33
Matrigel 0 0 100 100 100 100 100 100
By analyzing the state of gelation, we can obtain the HAMA nor Matrigel gel properly, i.e., they do not have a
printability (Pr), which is defined as: Pr equal to 1 or close to 1 to obtain a complex biomimetic
π 1 structure.
Pr = • (II)
4 C The 5% GelMA was able to print a square grid with
4π π 16 angles close to 90°C, although the gelation state was a little
If the figure is square → C= → Pr = • = 1 (III)
16 4 4π high since small hydrogel clots were visible. In view of the
This test also determines whether the hydrogel has results, only the “grid” of the 5% GelMA was quantified,
sufficient mechanical properties to generate a “grid” or since, on the one hand, the standard hydrogel is soluble
matrix of squares or rectangles of different dimensions, in water and therefore not useful to make a biomimetic
similar to the one shown in Figure 8 . structure that could be usable, and on the other hand, the
[35]
rest of the materials did not show an acceptable behavior
To perform this test, first, the area in mm of the grid in the previous tests. Regarding the 5% GelMA, the
2
was obtained/designed, which will be referred to as the quantification of the “grid” helps us to determine whether
theoretical value. Subsequently, the actual bioprinted area its gelation state, which is somewhat high, could be a
is measured, which will be referred to as the true value, problem to generate biomimetic structures.
and both values are compared using the statistical tool of
the standard deviation. In parallel, the value of Pr can be The squares were measured from left to right and
determined. from bottom to top, starting with the square in the lower
left corner, in row 1, and ending with the square in the
Once the dimensions of the designed matrix (theoretical upper right corner, in row 5. The measurements made are
value) are known, an image processing program is used to tabulated in Table 4, in which there is no great difference
obtain the real dimensions (real value) generated by the between the real value and the theoretical value.
hydrogel when creating the matrix. For this study, the
ColMA (Cs = 10) was eliminated, as it was the one that It should be noted that when printing the 5% GelMA
gave the worst results in the filament collapse test (Table 3). with the bioprinter, the smaller grid of theoretical area of
2
From the results in Table 3, it can be seen that neither 5% 0.42 mm generated overlapping layers and bioprinting
Volume 9 Issue3 (2023) 32 https://doi.org/10.18063/ijb.680