
Page 431 - IJB-9-6
P. 431
International Journal of Bioprinting Versatile pomelo peel-inspired structures
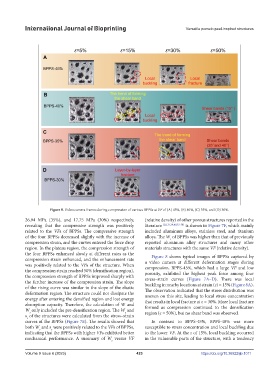
Figure 8. Video camera frames during compression of various BPPSs at VF of (A) 45%, (B) 40%, (C) 35%, and (D) 30%.
26.94 MPa (35%), and 17.75 MPa (30%) respectively, (relative density) of other porous structures reported in the
revealing that the compressive strength was positively literature [20,33,39,40,53-58] is shown in Figure 7F, which mainly
related to the VFs of BPPSs. The compressive strength included aluminum alloys, stainless steel, and titanium
of the four BPPSs decreased slightly with the increase of alloys. The W of BPPSs was higher than that of previously
s
compression strain, and the curves entered the force drop reported aluminum alloy structures and many other
region. In the plateau region, the compression strength of materials structures with the same VF (relative density).
the four BPPSs enhanced slowly at different rates as the Figure 8 shows typical images of BPPSs captured by
compression strain enhanced, and the enhancement rate a video camera at different deformation stages during
was positively related to the VFs of the structure. When compression. BPPS-45%, which had a large VF and low
the compression strain reached 50% (densification region), porosity, exhibited the highest peak force among four
the compression strength of BPPSs improved sharply with stress–strain curves (Figure 7A–D). There was local
the further increase of the compression strain. The slope buckling in nearby locations at strain (ε) = 15% (Figure 8A).
of the rising curve was similar to the slope of the elastic The observation indicated that the stress distribution was
deformation region. The structure could not dissipate the uneven on this site, leading to local stress concentration
energy after entering the densified region and lost energy that results in local fracture at ε = 30%. More local fracture
absorption capacity. Therefore, the calculation of W and formed as compression continued to the densification
W only included the pre-densification region. The W and region (ε = 50%), but no shear band was observed.
s
s
s of the structures were calculated from the stress–strain
s
curves of the BPPSs (Figure 7E). The results showed that In contrast to BPPS-45%, BPPS-40% was more
both W and s were positively related to the VFs of BPPSs, susceptible to stress concentration and local buckling due
s
s
indicating that the BPPSs with higher VFs exhibited better to the lower VF. At the ε of 15%, local buckling occurred
mechanical performance. A summary of W versus VF in the vulnerable parts of the structure, with a tendency
s
Volume 9 Issue 6 (2023) 423 https://doi.org/10.36922/ijb.1011