
Page 432 - IJB-9-6
P. 432
International Journal of Bioprinting Versatile pomelo peel-inspired structures
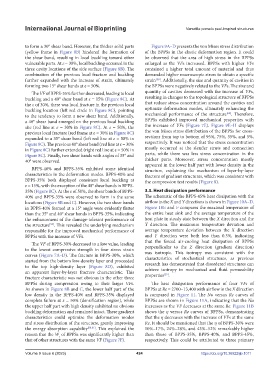
to form a 30° shear band. However, the thicker solid parts Figure 9A–D presents the von Mises stress distribution
(yellow frame in Figure 8B) hindered the formation of of the BPPSs in the elastic deformation region. It could
the shear band, resulting in local buckling toward other be observed that the area of high stress in the BPPSs
vulnerable parts. At ε = 30%, local buckling occurred in the enlarged as the VFs increased. BPPSs with higher VFs
three cavity locations of the side surface (Figure 8B). The contained a higher total amount of material and thus
combination of the previous local fracture and buckling demanded higher macroscopic stress to obtain a specific
further expanded with the increase of strain, ultimately strain . Additionally, the size and quantity of cavities in
[58]
forming two 15° shear bands at ε = 50%. the BPPSs were negatively related to the VFs. The size and
The VF of BPPS-35% further decreased, leading to local quantity of cavities decreased with the increase of VFs,
buckling and a 40° shear band at ε = 15% (Figure 8C). At resulting in changes to the topological structure of BPPSs
the ε of 30%, there was local fracture in the previous local that reduce stress concentration around the cavities and
buckling location (left red circle in Figure 8C), pointing optimize deformation modes, ultimately enhancing the
[62]
to the tendency to form a new shear band. Additionally, mechanical performance of the structure . Therefore,
a 40° shear band emerged on the previous local buckling BPPSs exhibited improved mechanical properties with
site (red line at ε = 30% in Figure 8C). At ε = 50%, the the increase of VFs (Figure 7E). Figure 9E–H displays
previous local fracture (red frame at ε = 30% in Figure 8C) the von Mises stress distribution of the BPPSs for cross-
expanded to a 35° shear band (left red line at ε = 50% in sections from top to bottom of 95%, 75%, 35%, and 5%,
Figure 8C). The previous 40° shear band (red line at ε = 30% respectively. It was noticed that the stress concentration
in Figure 8C) further extended (right red line at ε = 50% in mostly occurred at the slender struts and connection
Figure 8C). Finally, two shear bands with angles of 35° and parts, while there was less stress concentration in the
40° were observed. thicker parts. Moreover, stress concentration mostly
appeared in the lower half part with lower density in the
BPPS-40% and BPPS-35% exhibited some identical structure, explaining the mechanism of layer-by-layer
characteristics in the deformation modes. BPPS-40% and fracture of gradient structures, which was consistent with
BPPS-35% both displayed consistent local buckling at the compression test results (Figure 8).
ε = 15%, with the exception of the 40° shear bands in BPPS-
35% (Figure 8C). At the ε of 50%, the shear bands of BPPS- 3.3. Heat dissipation performance
40% and BPPS-35% were observed to form in the same The schematic of the BPPS-45% heat dissipation with the
locations (Figure 8B and C). However, the two shear bands airflow in the X and Y directions is shown in Figure 10A–D.
in BPPS-40% formed at a 15° angle were evidently flatter Figure 10E and F compares the maximal temperature of
than the 35° and 40° shear bands in BPPS-35%, indicating the entire heat sink and the average temperature of the
the enhancement of the damage-tolerant performance of heat plate in steady state between the X direction and the
the structure . This revealed the underlying mechanism Y direction. The maximum temperature deviation and
[59]
responsible for the improved mechanical performance of average temperature deviation between the X direction
BPPSs with the increase of VFs. and Y direction were both less than 0.3%, indicating
The VF of BPPS-30% decreased to a low value, leading that the forced air-cooling heat dissipation of BPPSs
to the lowest compressive strength in four stress–strain perpendicular to the Z direction (gradient direction)
was isotropic. This isotropy was consistent with the
curves (Figure 7A–D). The fracture in BPPS-30%, which characteristics of stochastical structures, as previous
started from the bottom low-density layer and proceeded research has demonstrated that disordered structures can
to the top high-density layer (Figure 8D), exhibited achieve isotropy in mechanical and fluid permeability
an apparent layer-by-layer fracture characteristic. This properties .
[25]
fracture characteristic was not obvious in the other three
BPPSs during compression owing to their larger VFs. The heat dissipation performance of four VFs of
As shown in Figure 8B and C, the lower half part of the BPPSs at Re = 2700–13,400 with airflow in the X direction
low density in the BPPS-40% and BPPS-35% displayed is compared in Figure 11. The Nu versus Re curves of
complete failure at ε = 50% (densification region), while BPPSs are shown in Figure 11A, indicating that the Nu
the upper half part with high density exhibited no obvious increases as the VF decreases at the same Re. Figure 11B
buckling deformation and remained intact. These gradient shows the η versus Re curves of BPPSs, demonstrating
characteristics could optimize the deformation modes that the η decreases with the increase of VFs at the same
and stress distribution of the structure, greatly improving Re. It should be mentioned that the η of BPPS-30% were
the energy absorption capability [60,61] . This explained the 10%–17%, 24%–28%, and 43%–52% remarkably higher
reason that the W of BPPSs was significantly higher than than those of BPPS-35%, BPPS-40%, and BPPS-45%,
s
that of other structures with the same VF (Figure 7F). respectively. This could be attributed to three primary
Volume 9 Issue 6 (2023) 424 https://doi.org/10.36922/ijb.1011