
Page 54 - IJB-9-6
P. 54
International Journal of Bioprinting Sub-regional design of the bionic bone scaffolds
Table 3. Values of a1 for different scale coefficients taking the target aperture range and computational
efficiency into account. Besides, randomness was supposed
C (%) a (μm) r (μm) Davg (μm) to be one of the possible influencing factors of the aperture
1
1
50 3333 833 1127 distribution as the generation of Voronoi nucleating points
60 2857 714 1131 relied on the random seeds. Therefore, five samples were
70 2500 625 1139 generated with different random seeds and the aperture
distribution is shown in Figure 5d. It is obvious that
80 2222 555 1139
although there were perturbations in aperture frequency
90 2000 500 1138 curves, the overall distribution remained the same and the
perturbations occurred mainly ranging from 100 μm to
1000 μm, with little effect on the actual bone implantation
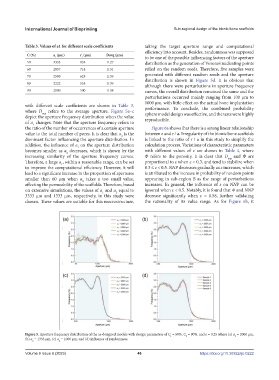
with different scale coefficients are shown in Table 3,
where D refers to the average aperture. Figure 5a–c performance. To conclude, the combined probability
avg
depict the aperture frequency distribution when the value sphere model design was effective, and the tests were highly
of a changes. Note that the aperture frequency refers to reproducible.
1
the ratio of the number of occurrences of a certain aperture Figure 6a shows that there is a strong linear relationship
value to the total number of pores. It is clear that a is the between ε and r / a. Irregularity of the bionic bone scaffolds
2
dominant factor influencing the aperture distribution. In is linked to the ratio of r / a in this study to simplify the
addition, the influence of a on the aperture distribution calculation process. Variations of characteristic parameters
1
becomes smaller as a decreases, which is shown by the with different values of ε are shown in Table 4, where
2
increasing similarity of the aperture frequency curves. Ф refers to the porosity. It is clear that D and Ф are
avg
Therefore, a large a , within a reasonable range, can be set proportional to ε when ε < 0.3, and tend to stabilize when
1
to improve the computational efficiency. However, it will 0.3 ≤ ε < 0.5. NNP decreases gradually as ε increases, which
lead to a significant increase in the proportion of apertures is attributed to the increase in probability of random points
smaller than 60 μm when a takes a too small value, appearing in sub-region B as the range of perturbations
2
affecting the permeability of the scaffolds. Therefore, based increases. In general, the influence of ε on NNP can be
on extensive simulations, the values of a and a equal to ignored when ε < 0.5. Notably, it is found that Ф and NNP
2
1
3333 μm and 1333 μm, respectively, in this study were decrease significantly when ε = 0.58, further validating
chosen. These values are suitable for this macrostructure, the rationality of its value range. As for Figure 6b, it
Figure 5. Aperture frequency distribution of the as-designed models with design parameters of C = 50%, C = 90%, and ε = 0.25 where (a) a = 2000 μm,
2
2
1
(b) a = 1333 μm, (c) a = 1000 μm, and (d) influence of randomness.
2 2
Volume 9 Issue 6 (2023) 46 https://doi.org/10.36922/ijb.0222