
Page 56 - IJB-9-6
P. 56
International Journal of Bioprinting Sub-regional design of the bionic bone scaffolds
face
cell
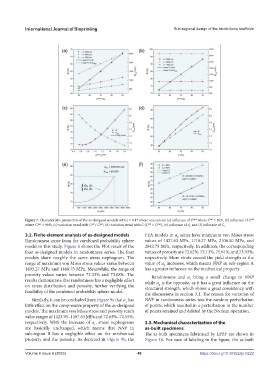
Figure 7. Characteristic parameters of the as-designed models with ε = 0.47 where one can see (a) influence of C where C = 50%, (b) influence of C
cell
where C = 90%, (c) variation trend with C / C , (d) variation trend with C (C = C ), (e) influence of d , and (f) influence of C .
face
face
cell
face
cell
i t
3.2. Finite element analysis of as-designed models FEA models in a series have maximum von Mises stress
2
Randomness arose from the combined probability sphere values of 1427.63 MPa, 1718.27 MPa, 2106.50 MPa, and
model in this study. Figure 8 shows the FEA result of the 2842.75 MPa, respectively. In addition, the corresponding
four as-designed models in randomness series. The four values of porosity are 72.62%, 72.13%, 71.61%, and 73.92%,
models share roughly the same stress nephogram. The respectively. More struts exceed the yield strength as the
range of maximum von Mises stress values varies between value of a increases, which means NNP in sub-region A
2
1403.27 MPa and 1468.75 MPa. Meanwhile, the range of has a greater influence on the mechanical property.
porosity values varies between 72.33% and 73.08%. The Randomness and a bring a small change to NNP
results demonstrate that randomness has a negligible effect while a is the opposite, as it has a great influence on the
1
on stress distribution and porosity, further verifying the structural strength, which shows a great consistency with
2
feasibility of the combined probability sphere model. the discussions in section 3.1. The reason for variation of
Similarly, it can be concluded from Figure 9a that a has NNP in randomness series was the random perturbation
1
little effect on the compressive property of the as-designed of points, which resulted in a perturbation in the number
models. The maximum von Mises stress and porosity reach of points retained and deleted by the Boolean operation.
value ranges of 1423.95–1497.63 MPa and 72.83%–74.55%,
respectively. With the increase of a , stress nephograms 3.3. Mechanical characterization of the
1
are basically unchanged, which means that NNP in as-built specimens
sub-region B has a negligible effect on the mechanical The as-built specimens fabricated by LPBF are shown in
property and the porosity. As depicted in Figure 9b, the Figure 10. For ease of labeling in the figure, the as-built
Volume 9 Issue 6 (2023) 48 https://doi.org/10.36922/ijb.0222