
Page 57 - IJB-9-6
P. 57
International Journal of Bioprinting Sub-regional design of the bionic bone scaffolds
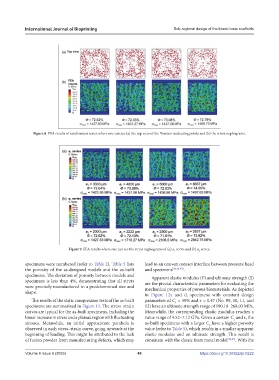
Figure 8. FEA results of randomness series where one can see (a) the top view of the Voronoi nucleating points and (b) the stress nephograms.
Figure 9. FEA results where one can see the stress nephograms of (a) a series and (b) a series.
1 2
specimens were numbered (refer to Table 2). Table 5 lists lead to an uneven contact interface between pressure head
the porosity of the as-designed models and the as-built and specimens [36,42,43] .
specimens. The deviation of porosity between models and Apparent elastic modulus (E) and ultimate strength (S)
specimens is less than 4%, demonstrating that all struts are the pivotal characteristic parameters for evaluating the
were precisely manufactured to a predetermined size and mechanical properties of porous biomaterials. As depicted
shape.
in Figure 12a and d, specimens with constant design
The results of the static compression tests of the as-built parameters of C = 50% and ε = 0.47 (No. 09, 10, 11, and
1
specimens are summarized in Figure 11. The stress–strain 12) have an ultimate strength range of 190.19–268.03 MPa.
curves are typical for the as-built specimens, including the Meanwhile, the corresponding elastic modulus reaches a
linear increase in stress and a plateau region with fluctuating value range of 4.52–7.12 GPa. Given a certain C and ε, the
1
stresses. Meanwhile, an initial approximate parabola is as-built specimens with a larger C have a higher porosity
2
observed in each stress–strain curve, going upwards at the value (refer to Table 5), which results in a smaller apparent
beginning of loading. This might be attributed to the lack elastic modulus and an ultimate strength. This result is
of fusion powder from manufacturing defects, which may consistent with the classic foam metal model [44,45] . With the
Volume 9 Issue 6 (2023) 49 https://doi.org/10.36922/ijb.0222