
Page 58 - IJB-9-6
P. 58
International Journal of Bioprinting Sub-regional design of the bionic bone scaffolds
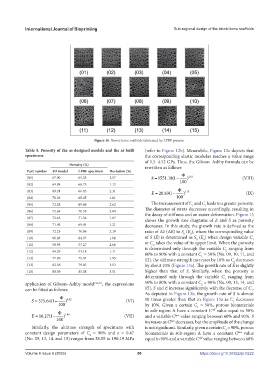
Figure 10. Bionic bone scaffolds fabricated by LPBF process.
Table 5. Porosity of the as-designed models and the as-built (refer to Figure 12b). Meanwhile, Figure 12e depicts that
specimens the corresponding elastic modulus reaches a value range
of 1.5–4.52 GPa. Thus, the Gibson–Ashby formula can be
Porosity (%) rewritten as follows:
Part number 3D model LPBF specimen Deviation (%)
Φ
(01) 67.90 65.33 2.57 S = 1551 18 1.( − ) 163. (VIII)
(02) 69.88 68.75 1.13 100
(03) 69.24 66.93 2.31 E = 20 83 1.( − Φ ) 117. (IX)
(04) 70.26 68.45 1.81 100
(05) 72.28 69.66 2.62 The increasement of C and C leads to a greater porosity.
2
1
(06) 72.63 70.59 2.04 The diameter of struts decreases accordingly, resulting in
the decay of stiffness and an easier deformation. Figure 13
(07) 72.43 71.36 1.07 shows the growth rate diagrams of E and S as porosity
(08) 71.05 69.84 1.21 decreases. In this study, the growth rate is defined as the
(09) 72.25 70.06 2.19 ratio of ΔS (ΔE) to S (E ), where the corresponding value
0
0
(10) 66.03 64.97 1.06 of S (E) is determined as S (E ) when design variable C
1
0
0
or C takes the value of its upper limit. When the porosity
(11) 59.93 57.27 2.66 is determined only through the variable C ranging from
2
(12) 54.29 53.18 1.11 60% to 90% with a constant C = 50% (No. 09, 10, 11, and
2
1
(13) 77.89 75.94 1.95 12), the ultimate strength increases by 10% as C decreases
2
(14) 83.36 79.83 3.53 by about 10% (Figure 13a). The growth rate of E is slightly
(15) 88.59 85.08 3.51 higher than that of S. Similarly, when the porosity is
determined only through the variable C ranging from
1
application of Gibson–Ashby model [46,47] , the expressions 50% to 80% with a constant C = 90% (No. 09, 13, 14, and
2
can be fitted as follows: 15), S and E increase significantly with the decrease of C .
1
As depicted in Figure 13b, the growth rate of S is almost
Φ 10 times greater than that in Figure 13a as C decreases
S = 375 64 1.( − ) 052. (VI) 1
100 by 10%. Given a certain C = 50%, porous biomaterials
1
in sub-region A have a constant C value equal to 50%
cell
Φ
E = 16 27 1.( − ) 106. (VII) and a variable C value ranging between 60% and 90%. S
face
100 increases as C decreases, but the amplitude of the change
face
Similarly, the ultimate strength of specimens with is not significant. Similarly, given a certain C = 90%, porous
2
constant design parameters of C = 90% and ε = 0.47 biomaterials in sub-region A have a constant C value
face
2
(No. 09, 13, 14, and 15) ranges from 38.55 to 190.19 MPa equal to 90% and a variable C value ranging between 60%
cell
Volume 9 Issue 6 (2023) 50 https://doi.org/10.36922/ijb.0222