
Page 55 - IJB-9-6
P. 55
International Journal of Bioprinting Sub-regional design of the bionic bone scaffolds
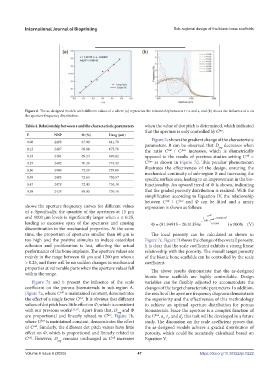
Figure 6. The as-designed models with different values of ε where (a) represents the relationship between r / a and ε, and (b) shows the influence of ε on
the aperture frequency distribution.
Table 4. Relationship between ε and the characteristic parameters when the value of dot pitch is determined, which indicated
that the aperture is only controlled by C .
face
Ε NNP Ф (%) Davg (μm)
Figure 7c shows the gradient change of the characteristic
0.06 2498 67.90 641.70
parameters. It can be observed that D decreases when
avg
0.12 2487 69.88 673.78 the ratio C / C increases, which is diametrically
cell
face
0.18 2484 69.24 696.02 opposed to the results of previous studies setting C =
cell
face
0.25 2482 70.26 716.32 C as shown in Figure 7d. This peculiar phenomenon
illustrates the effectiveness of the design, ensuring the
0.30 2480 72.28 729.88
mechanical continuity of sub-region B and increasing the
0.39 2483 72.63 730.57 specific surface area, leading to an improvement in the bio-
0.47 2479 72.43 730.18 functionality. An upward trend of Ф is shown, indicating
0.58 2435 69.05 730.16 that the graded porosity distribution is realized. With the
simplification according to Equation IV, the relationship
between C / C and Ф can be fitted and a unary
cell
face
shows the aperture frequency curves for different values expression is shown as follows:
of ε. Specifically, the quantity of the apertures at 15 μm
and 1000 μm levels is significantly larger when ε ≤ 0.25, ( C cell cell − . 0 60613 ) 2
leading to excessive span of the apertures and causing Φ= (.91 94915 20 .31354e − 140 −C . 1 61989 ) ×1000% (V)
−
discontinuities in the mechanical properties. At the same
time, the proportion of apertures smaller than 60 μm is The local porosity can be calculated as shown in
too high and the positive stimulus to induce osteoblast Figure 7e. Figure 7f shows the change of the overall porosity.
adhesion and proliferation is lost, affecting the actual It is clear that the scale coefficient exhibits a strong linear
performance of the bone implants. The aperture values are relationship with the porosity. The overall target porosity
mainly in the range between 60 μm and 1200 μm when ε of the bionic bone scaffolds can be controlled by the scale
> 0.25, and there will be no sudden changes in mechanical coefficient.
properties at vulnerable parts when the aperture values fall The above results demonstrate that the as-designed
within the range.
bionic bone scaffolds are highly controllable. Design
Figure 7a and b present the influence of the scale variables can be flexibly adjusted to accommodate the
coefficient on the porous biomaterials in sub-region A. changes of the target characteristic parameters. In addition,
Figure 7a, where C is maintained constant, demonstrates the results of the aperture frequency diagrams demonstrate
cell
the effect of a single factor C . It is obvious that different the superiority and the effectiveness of this methodology
face
values of dot pitch have little effect on Ф, which is consistent to achieve an optimal aperture distribution for porous
with our previous works [12,13] . Apart from that, D and Ф biomaterials. Since the aperture is a complex function of
avg
are proportional and linearly related to C . Figure 7b, the C , a , r , and d , this task will be developed in a future
face
face
t
i
t
where C is maintained constant, demonstrates the effect study. The discussion on the scale coefficient proves that
face
of C . Similarly, the different dot pitch values have little the as-designed models achieve a graded distribution of
cell
effect on Ф, which is proportional and linearly related to porosity, which could be accurately calculated based on
C . However, D remains unchanged as C increases Equation V.
cell
cell
avg
Volume 9 Issue 6 (2023) 47 https://doi.org/10.36922/ijb.0222