
Page 15 - IJOCTA-15-1
P. 15
A nonlinear mathematical model to describe the transmission dynamics of the citrus canker epidemic
___γ=1,___γ=0.95,___γ=0.90,___γ=0.85
m I(t)
X n 400000
(−1) (2n + 1)I n = I 0 ,
n=0
300000
m
X n
(−1) (2n + 1)P n = P 0 ,
200000
n=0 (59)
m
X n 100000
(−1) (2n + 1)B n = B 0 ,
n=0 t
m 50 100 150 200 250 300
X n
(−1) (2n + 1)E n = E 0 .
Figure 2. Change in the infec-
n=0
tious citrus plant population I(t)
with respect to time t at γ =
Therefore, Eqs. (55)-(58) and (59), give a nonlin- 1, 0.95, 0.90, 0.85.
ear system of 4(m + 1) algebraic equations. This
system of algebraic equations is simulated for the
unknowns: I n , P n , B n , E n (n = 0, 1, ..., m) with ___γ=1,___γ=0.95,___γ=0.90,___γ=0.85
B(t)
the application of the Newton-Raphson iterative 1.4 × 10 6
scheme. 1.2 × 10 6
1.0 × 10 6
800000
600000
4.1. Graphical simulations 400000
200000
To plot the above-given solution of the fractional- t
order model, we code our solution system using 50 100 150 200 250 300
Mathematica. For the graphical simulations, nu- Figure 3. Change in the bacteria
merical values of the proposed parameters are population B(t) with respect to time
mentioned in Table 1 where some of the values t at γ = 1, 0.95, 0.90, 0.85.
are estimated from the data given in the studies
5
6
on citrus canker in Florida, Argentina, Brazil, 7 Figure 4 is plotted for the change in the amount of
8
and the United States. The rest of the values environmental discharges. Here we notice that the
are fixed or assumed according to the informa- continuous increment in the amount of environ-
tion given on the CAB International Website. 1 mental discharge challenges the control measures
The initial population sizes are taken as follows: to stop the transmission of the canker. Variations
I 0 = 600, P 0 = 400000, B 0 = 100000 and
in the infectious class I(t) with respect to the bac-
E 0 = 10000.
teria population B(t) can be seen from figure 5.
Figure 6 is plotted to show variations in the in-
fectious class I(t) versus density of environmental
discharges E(t).
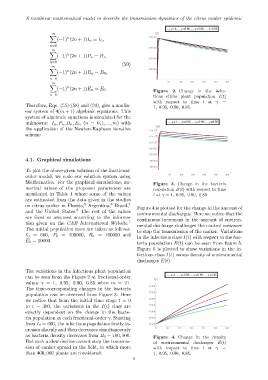
The variations in the infectious plant population
___γ=1,___γ=0.95,___γ=0.90,___γ=0.85
can be seen from the Figure 2 at fractional-order
E(t)
values γ = 1, 0.95, 0.90, 0.85 when m = 21.
13000
The time-corresponding changes in the bacteria
12500
population can be observed from Figure 3. Here
we notice that from the initial time stage t = 0 12000
to t = 300, the variations in the I(t) class are 11500
exactly dependent on the change in the bacte- 11000
ria population at each fractional-order γ. Starting 10500
from I 0 = 600, the infectious population firstly in- 10000
t
creases sharply and then decreases simultaneously 0 50 100 150 200 250 300
as bacteria density decreases from B 0 = 100, 000.
Figure 4. Change in the density
But such a slow decline cannot stop the transmis- of environmental discharges E(t)
sion of canker spread in the field, in which more with respect to time t at γ =
than 400, 000 plants are considered. 1, 0.95, 0.90, 0.85.
9