
Page 20 - IJOCTA-15-4
P. 20
M. A. Aman et al. / IJOCTA, Vol.15, No.4, pp.549-577 (2025)
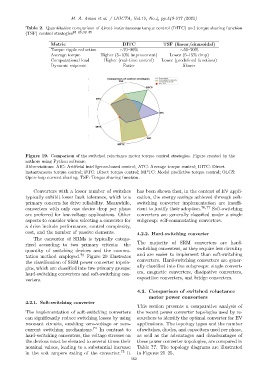
Table 2. Quantitative comparison of direct instantaneous torque control (DITC) and torque sharing function
(TSF) control strategies 23–26,32–35
Metric DITC TSF (linear/sinusoidal)
Torque ripple reduction ∼70–90% ∼50–70%
Average torque Higher (5–10% improvement) Lower (5–15% drop)
Computational load Higher (real-time control) Lower (predefined functions)
Dynamic response Faster Slower
Figure 19. Comparison of the switched reluctance motor torque control strategies. Figure created by the
authors using Python software
Abbreviations: AIC: Artificial intelligence-based control; ATC: Average torque control; DITC: Direct
instantaneous torque control; DTC: Direct torque control; MPTC: Model predictive torque control; OLCS:
Open-loop current sharing; TSF: Torque sharing function.
Converters with a lesser number of switches has been shown that, in the context of EV appli-
typically exhibit lower fault tolerance, which is a cation, the energy savings achieved through soft-
primary concern for drive reliability. Meanwhile, switching converter implementation are insuffi-
converters with only one device drop per phase cient to justify their adoption. 76,77 Soft-switching
are preferred for low-voltage applications. Other converters are generally classified under a single
aspects to consider when selecting a converter for subgroup: self-commutating converters.
a drive include performance, control complexity,
cost, and the number of passive elements. 4.2.2. Hard-switching converter
The converter of SRMs is typically catego-
The majority of SRM converters are hard-
rized according to two primary criteria: the
switching converters, as they require less circuitry
quantity of switching devices and the commu-
tation method employed. 73 Figure 20 illustrates and are easier to implement than soft-switching
converters. Hard-switching converters are gener-
the classification of SRM power converter topolo-
ally classified into five subgroups: single convert-
gies, which are classified into two primary groups:
ers, magnetic converters, dissipative converters,
hard-switching converters and soft-switching con-
capacitive converters, and bridge converters.
verters.
4.3. Comparison of switched reluctance
motor power converters
4.2.1. Soft-switching converter
This section presents a comparative analysis of
The implementation of soft-switching converters the recent power converter topologies used by re-
can significantly reduce switching losses by using searchers to identify the optimal converter for EV
resonant circuits, enabling zero-voltage or zero- applications. The topology types and the number
current switching mechanisms. 74 In contrast to of switches, diodes, and capacitors used per phase,
hard-switching converters, the voltage stresses on as well as the advantages and disadvantages of
the devices must be elevated to several times their these power converter topologies, are compared in
nominal values, leading to a substantial increase Table ??. The topology diagrams are illustrated
in the volt–ampere rating of the converter. 75 It in Figures 21–25.
562