
Page 150 - IJPS-11-3
P. 150
International Journal of
Population Studies Family planning and its economic outcomes
had dropped to just 0.65, indicating that the LF-entrance 3.50
population was only 65% of the LF-exit population. 3.00 3.10
Sometime between 2010 and 2020, the LF-exit population 2.50
overtook the LF-entrance population. 2.00 1.99 2.29 2.24
1.70 1.81
Overall, between 1953 and 2020, the LF-entrance 1.50 1.46
1.13
group has consistently shrunk, while the LF-exit group 1.00 1.00 1.00 1.00 0.97 1.00 0.65 0.59 0.81
0.89
1.00
0.74
has grown larger. Consequently, the number of workers 0.50 0.90 0.67 0.53 0.45
0.37
nearing retirement now exceeds those preparing to enter 0.00 1953 1982 1990 2000 2010 2020
the labor market. This trend illustrates both the future Child_D Old-age_D Total_D Public Expenditures
shrinkage of the labor force and its aging composition.
By 2020, the LF-exit group accounted for 27.1% of Figure 3. The variation of child, old age, total dependency ratio, and
public expenditures between 1953 and 2020 in China
the working-age population, meaning over a quarter Sources: Census data in 1953, 1982, 1990, 2000, 2010, and 2020 in China.
of the current labor force is expected to retire within
the next decade – an all-time high in Chinese census
history. The aging of the baby boomer cohorts born in almost 2.5 times higher than in 1953. This indicates that,
the 1960s and 1970s has accelerated both the shrinkage if the pension system in China is pay-as-you-go (like the
and aging of the working-age population. These trends coordinated pension in China), to simply keep the same
pose significant challenges for workforce management, pension level of those retired, the pension contribution
including the transfer of institutional knowledge, retention rate of those in the labor force should be more than
of experienced employees, and the renewal of the labor doubled, which is a big economic burden for the working-
force. Moreover, the shrinkage of working-age population age population. While global trends attribute 75% of
or labor force could be detrimental to economic growth population aging to fertility decline and the remaining 25%
simply because less people are involved in economic to mortality decline (Kerr & Beaujot, 2016), China’s rapid
activities. In addition, a shrinking labor force could highly fertility declines due to the coercive “one-child” policy
reduce government revenue because there are less and contributed disproportionately to its aging population.
less taxpayers. Furthermore, an aging labor force would The total fertility rate dropped below replacement level in
undermine economic growth because of lower flexibility, 1991, just over a decade after the policy’s implementation
innovativeness, and productivity (Kerr & Beaujot, 2016). (United Nations, 2022), suggesting that fertility decline
accounted for much more than 75% of population aging
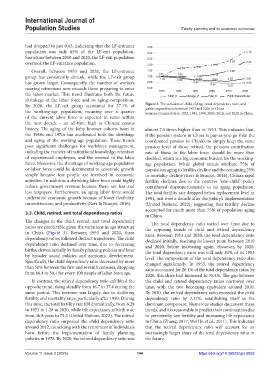
3.3. Child, retired, and total dependency ratios
in China.
The changes in the child, retired, and total dependency The total dependency ratio varied over time due to
ratios are predictable given the variations in age structure the opposing trends of child and retired dependency
in China (Figure 3). Between 1953 and 2020, these rates. Between 1953 and 2020, the total dependency ratio
dependency ratios followed distinct trajectories. The child declined initially, reaching its lowest point between 2010
dependency ratio declined over time, due to decreasing and 2020, before increasing again. However, by 2020,
births, driven initially by family planning policies and later the total dependency ratio was still only 81% of its 1953
by broader social policies and economic development. level. The composition of the total dependency ratio also
Specifically, the child dependency ratio decreased by more changed significantly. In 1953, the retired dependency
than 50% between the first and seventh censuses, dropping ratio accounted for 20.1% of the total dependency ratio; by
from 66.4 to 30.1 for every 100 people of labor-force age.
2020, this share had increased to 55.4%. The gap between
In contrast, the retired dependency ratio exhibited the the child and retired dependency ratios narrowed over
opposite trend, rising steadily from 16.7 to 37.4 during the time, with the two becoming equivalent around 2010.
same period. This increase was largely due to declining By 2020, the retired dependency ratio exceeded the child
fertility and mortality rates, particularly after 1990. During dependency ratio by 7.27%, establishing itself as the
this time, the total fertility rate fell dramatically, from 6.28 dominant component. Numerous studies document these
in 1953 to 1.28 in 2020, while life expectancy at birth rose trends, and it is reasonable to predict their continuation due
from 46.8 years to 75.3 (United Nations, 2022). The retired to persistently low fertility and increasing life expectancy
dependency ratio surpassed the child dependency ratio in China (Zhang, 2017; Wolf Jr. et al., 2011). This indicates
around 2012, coinciding with the retirement of individuals that the retired dependency ratio will account for an
born before the implementation of family planning increasingly larger share of the total dependency ratio in
policies in 1978. By 2020, the retired dependency ratio was the future.
Volume 11 Issue 3 (2025) 144 https://doi.org/10.36922/ijps.6859