
Page 148 - IJPS-11-3
P. 148
International Journal of
Population Studies Family planning and its economic outcomes
(aged 0 – 14) increased by 1.23 times, the working-age
40.00
population by 1.72 times, and the retired population by
total population Population aged 0 more than five times. Similar trends, albeit in opposite
36.17
35.00 Child Working-age directions, are reflected in terms of proportional change
as well. The proportion of child population to total
Retired 75+
population steadily declined, falling from 36.3% in 1953
30.00 to 18.0% in 2020. In contrast, the working-age population
85+ Median age
exhibited a curvilinear trend: its proportion increased
until sometime between 2010 and 2020 when it began to
25.00 decline. This increase was driven by three key factors: the
entry into the workforce of the second childbearing wave
(those born between 1962 and 1976), the decline in the
20.00
child population due to family planning policies, and the
17.87 so-called demographic echo effect, wherein the children of
the second childbearing wave cohort (born between 1982
15.00
and 1991, the third childbearing wave in China) entered
st
12.31 the workforce during the first decade of the 21 century
10.00 (Wolf Jr. et al., 2011). However, projections indicate that
9.39 the working-age population peaked between 2008 and
8.23
2009 and will continue to decline, assuming retirement
6.09
5.00 5.45 5.13 ages remain fixed at 60 for both men and women
3.16 4.21
3.42
2.51 1.80 2.26 2.26 2.95 2.88 2.72 (United Nations, 2022).
2.60
2.48
2.35
1.00
1.00
1.00
1.001.001.001.00 1.64 1.77 1.99 2.19 1.60 1.76 The working-age population produces the goods and
1.00
1.38
1.36
1.52
1.85
1.23
1.08
0.00 1.100.99 1.11 1.22 0.73 0.73 0.63
1953 1982 1990 2000 2010 2020 services that drive China’s economy. In 2020, this group
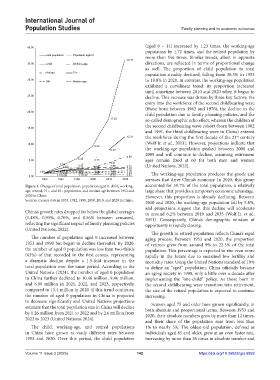
Figure 1. Change of total population, population aged 0, child, working- accounted for 59.7% of the total population, a relatively
age, retired, 75+, and 85+ population, and median age between 1953 and large share that provides a temporary economic advantage.
2020 in China However, this proportion is already declining. Between
Sources: Census data in 1953, 1982, 1990, 2000, 2010, and 2020 in China.
2010 and 2020, the working-age population fell by 5.8%,
and projections suggest that this decline will accelerate
China’s growth rates dropped far below the global averages to around 6.2% between 2019 and 2035 (Wolf Jr. et al.,
(1.48%, 0.95%, 0.70%, and 0.56% between censuses), 2011). Consequently, China’s demographic window of
reflecting the significant impact of family planning policies opportunity is rapidly closing.
(United Nations, 2022).
The growth in retired population reflects China’s rapid
The number of population aged 0 increased between aging process. Between 1953 and 2020, the proportion
1953 and 1990 but began to decline thereafter. By 2020, of retirees grew from around 9% to 22.3% of the total
the number of aged 0 population was less than two-thirds population. This percentage is expected to rise even more
(63%) of that recorded in the first census, representing rapidly in the future due to sustained low fertility and
a dramatic decline despite a 1.5-fold increase in the mortality rates. Using the United Nations standard of 10%
total population over the same period. According to the to define an “aged” population, China officially became
United Nations (2024), the number of aged 0 population an aging society in 1990, only a little over a decade after
in China further declined to 10.46 million, 9.46 million, implementing the “one-child” policy. As those born in
and 8.90 million in 2021, 2022, and 2023, respectively, the second childbearing wave transition into retirement,
compared to 13.4 million in 2020. If this trend continues, the size of the retired population is expected to continue
the number of aged 0 population in China is projected increasing.
to decrease significantly and United Nations projections Seniors aged 75 and older have grown significantly, in
estimate that the total population size in China will decline both absolute and proportional terms. Between 1953 and
by 1.26 million from 2021 to 2022 and by 2.6 million from 2020, their absolute numbers grew by more than 12 times,
2022 to 2023 (United Nations, 2024). and their share of the population rose from less than
The child, working-age, and retired populations 1% to nearly 5%. The oldest-old population, defined as
in China have grown at vastly different rates between individuals aged 85 and older, grew at an even faster rate,
1953 and 2020. Over this period, the child population increasing by more than 36 times in absolute number and
Volume 11 Issue 3 (2025) 142 https://doi.org/10.36922/ijps.6859