
Page 67 - IMO-2-1
P. 67
Innovative Medicines & Omics Flavonoids against glycosidic hydrolase
A B
C D
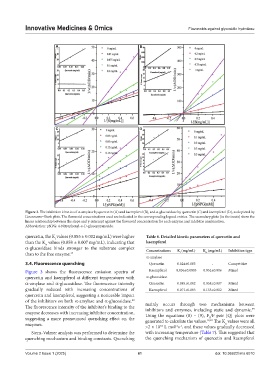
Figure 2. The inhibition kinetics of α-amylase by quercetin (A) and kaempferol (B), and α-glucosidase by quercetin (C) and kaempferol (D), as depicted by
Lineweaver–Burk plots. The flavonoid concentrations used are indicated in the corresponding legend entries. The secondary plots (in the insets) show the
linear relationship between the slope and y-intercept against the flavonoid concentration for each enzyme and inhibitor combination.
Abbreviation: pNPG: 4-Nitrophenyl-α-D-glucopyranoside.
quercetin, the K values (0.085 ± 0.002 mg/mL) were higher Table 6. Detailed kinetic parameters of quercetin and
i
than the K values (0.058 ± 0.007 mg/mL), indicating that kaempferol
is
α-glucosidase binds stronger to the substrate complex Concentrations K (mg/mL) K (mg/mL) Inhibition type
than to the free enzyme. 37 i is
α-amylase
3.4. Fluorescence quenching Quercetin 0.024±0.003 - Competitive
Figure 3 shows the fluorescence emission spectra of Kaempferol 0.036±0.0003 0.051±0.006 Mixed
quercetin and kaempferol at different temperatures with α-glucosidase
α-amylase and α-glucosidase. The fluorescence intensity Quercetin 0.085±0.002 0.058±0.007 Mixed
gradually reduced with increasing concentrations of Kaempferol 0.071±0.003 0.155±0.012 Mixed
quercetin and kaempferol, suggesting a noticeable impact
of the inhibitors on both α-amylase and α-glucosidase.
38
The fluorescence intensity of the inhibitor’s binding to the mainly occurs through two mechanisms between
inhibitors and enzymes, including static and dynamic.
39
enzyme decreases with increasing inhibitor concentration, Using the equations (8) – (9), F /F pair [Q] plots were
suggesting a more pronounced quenching effect on the generated to calculate the values. 12,40 The K values were all
0
q
enzymes. >2 × 10 L mol s , and these values gradually decreased
-1 -1
10
Stern-Volmer analysis was performed to determine the with increasing temperature (Table 7). This suggested that
quenching mechanism and binding constants. Quenching the quenching mechanism of quercetin and kaempferol
Volume 2 Issue 1 (2025) 61 doi: 10.36922/imo.6010