
Page 68 - IMO-2-1
P. 68
Innovative Medicines & Omics Flavonoids against glycosidic hydrolase
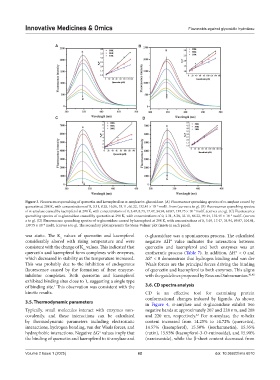
A B
C D
Figure 3. Fluorescence quenching of quercetin and kaempferol on α-amylase/α-glucosidase. (A) Fluorescence quenching spectra of α-amylase caused by
quercetin at 298 K, with concentrations of 0, 3.31, 8.28, 16.56, 33.11, 66.22, 132.45 × 10 mol/L from (curves a to g). (B) Fluorescence quenching spectra
−6
of α-amylase caused by kaempferol at 298 K, with concentrations of 0, 3.49, 8.73, 17.47, 34.94, 69.87, 139.75 × 10 mol/L (curves a to g). (C) Fluorescence
−6
quenching spectra of α-glucosidase caused by quercetin at 298 K, with concentrations of 0, 3.31, 8.28, 33.11, 66.22, 99.34, 132.45 × 10 mol/L (curves
−6
a to g). (D) Fluorescence quenching spectra of α-glucosidase caused by kaempferol at 298 K, with concentrations of 0, 3.49, 17.47, 34.94, 69.87, 104.81,
139.75 × 10 mol/L (curves a to g). The secondary plot represents the Stern-Volmer plot (insets in each panel).
−6
was static. The K values of quercetin and kaempferol α-glucosidase was a spontaneous process. The calculated
a
considerably altered with rising temperature and were negative ∆H° value indicates the interaction between
consistent with the change of K values. This indicated that quercetin and kaempferol and both enzymes was an
sv
quercetin and kaempferol form complexes with enzymes, exothermic process (Table 7). In addition, ∆H° < 0 and
which decreased in stability as the temperature increased. ∆S° < 0 demonstrate that hydrogen binding and van der
This was probably due to the inhibition of endogenous Waals forces are the principal forces driving the binding
fluorescence caused by the formation of these enzyme- of quercetin and kaempferol to both enzymes. This aligns
inhibitor complexes. Both quercetin and kaempferol with the guidelines proposed by Ross and Subramanian. 41,42
exhibited binding sites close to 1, suggesting a single type
of binding site. This observation was consistent with the 3.6. CD spectra analysis
1
kinetic results. CD is an effective tool for examining protein
conformational changes induced by ligands. As shown
3.5. Thermodynamic parameters in Figure 4, α-amylase and α-glucosidase exhibit two
Typically, small molecules interact with enzymes non- negative bands at approximately 207 and 228 nm, and 208
covalently, and these interactions can be calculated and 220 nm, respectively. For α-amylase, the α-helix
43
by thermodynamic parameters including electrostatic content increased from 14.25% to 14.72% (quercetin),
interactions, hydrogen bonding, van der Waals forces, and 14.57% (kaempferol), 15.50% (isorhamnetin), 15.35%
hydrophobic interactions. Negative ∆G values imply that (rutin), 15.93% (kaempferol-3-O-rutinoside), and 15.90%
o
the binding of quercetin and kaempferol to α-amylase and (narcissoside), while the β-sheet content decreased from
Volume 2 Issue 1 (2025) 62 doi: 10.36922/imo.6010