
Page 36 - ITPS-6-2
P. 36
INNOSC Theranostics and
Pharmacological Sciences Residual versus curative antimalarial tests
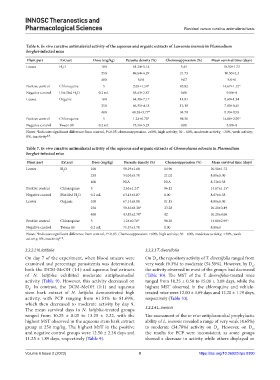
Table 6. In vivo curative antimalarial activity of the aqueous and organic extracts of Lawsonia inermis in Plasmodium
berghei‑infected mice
Plant part Extract Dose (mg/kg) Parasite density (%) Chemosuppression (%) Mean survival time (days)
Leaves H O 100 61.24±5.14 3.45 10.50±1.73
2
250 49.64±6.29 21.73 10.50±2.3
400 N/A 9.07 9.0±0
Positive control Chloroquine 5 2.65±1.24* 95.82 14.67±1.15*
Negative control Distilled H O 0.2 mL 63.43±2.87 0.00 9.00±0
2
Leaves Organic 100 64.38±7.17 14.81 8.60±1.34
250 66.35±4.18 12.19 7.80±0.45
400 49.28±3.77* 34.79 8.33±0.58
Positive control Chloroquine 5 1.24±0.70* 98.36 14.80±2.95*
Negative control Tween 80 0.2 mL 75.56±5.23 0.00 8.00±0
Notes: *Indicates significant difference from control, P≤0.05; chemosuppression: ≥60%, high activity; 30 – 60%, moderate activity; <30%, weak activity;
[13]
0%, inactivity .
Table 7. In vivo curative antimalarial activity of the aqueous and organic extracts of Chromolaena odorata in Plasmodium
berghei‑infected mice
Plant part Extract Dose (mg/kg) Parasite density (%) Chemosuppression (%) Mean survival time (days)
Leaves H O 100 58.19±1.08 14.96 10.50±1.73
2
250 54.04±5.70 21.02 8.00±0.00
400 N/A N/A 8.33±0.58
Positive control Chloroquine 5 2.65±1.24* 96.12 14.67±1.15*
Negative control Distilled H O 0.2 mL 63.43±2.87 0.00 8.67±0.58
2
Leaves Organic 100 67.14±8.00 11.15 8.00±0.00
250 50.42±8.38* 33.28 10.20±3.49
400 43.83±2.78* 42 10.20±4.66
Positive control Chloroquine 5 1.24±0.70* 98.36 14.80±2.95*
Negative control Tween 80 0.2 mL 75.57±3.70 0.00 8.00±0
Notes: *Indicates significant difference from control, P≤0.05. Chemosuppression: ≥60%, high activity; 30 – 60%, moderate activity; <30%, weak
[13]
activity; 0%, inactivity .
3.2.2.2 N. latifolia 3.2.2.3 T. diversifolia
On day 7 of the experiment, when blood smears were On D , the repository activity of T. diversifolia ranged from
7
examined and percentage parasitemia was determined, very weak (9.3%) to moderate (54.59%). However, by D ,
9
both the DCM-MeOH (1:1) and aqueous leaf extracts the activity observed in most of the groups had decreased
of N. latifolia exhibited moderate antiplasmodial (Table 10). The MST of the T. diversifolia-treated mice
activity (Table 9). However, this activity decreased on ranged from 10.25 ± 0.50 to 15.00 ± 3.08 days, while the
D . In contrast, the DCM-MeOH (1:1) and aqueous highest MST observed in the chloroquine and vehicle-
8
stem bark extract of N. latifolia demonstrated high treated mice were 12.00 ± 4.69 days and 12.20 ± 1.79 days,
activity, with PCP ranging from 61.51% to 81.69%, respectively (Table 10).
which then decreased to moderate activity by day 9.
The mean survival days in N. latifolia-treated groups 3.2.2.4 L. inermis
ranged from 10.25 ± 0.05 to 13.25 ± 2.22, with the The assessment of the in vivo antiplasmodial prophylactic
highest MST observed in the aqueous stem bark extract ability of L. inermis revealed a range of very weak (4.65%)
group at 250 mg/kg. The highest MST in the positive to moderate (34.78%) activity on D . However, on D ,
6
9
and negative control groups were 12.50 ± 2.38 days and the results for PCP were inconsistent, as some groups
11.25 ± 1.89 days, respectively (Table 9). showed a decrease in activity while others displayed an
Volume 6 Issue 2 (2023) 9 https://doi.org/10.36922/itps.0300