
Page 35 - ITPS-6-2
P. 35
INNOSC Theranostics and
Pharmacological Sciences Residual versus curative antimalarial tests
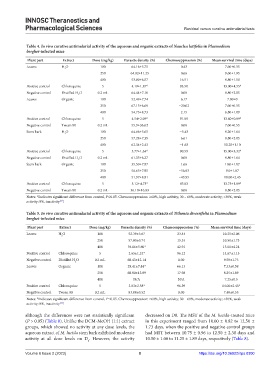
Table 4. In vivo curative antimalarial activity of the aqueous and organic extracts of Nauclea latifolia in Plasmodium
berghei‑infected mice
Plant part Extract Dose (mg/kg) Parasite density (%) Chemosuppression (%) Mean survival time (days)
Leaves H O 100 64.16±5.75 0.43 7.60±0.55
2
250 64.02±11.25 0.66 9.60±1.95
400 53.80±6.57 16.51 9.80±1.10
Positive control Chloroquine 5 4.19±1.87* 93.50 13.00±4.55*
Negative control Distilled H O 0.2 mL 64.44±7.10 0.00 8.80±2.05
2
Leaves Organic 100 52.49±7.74 6.17 7.00±0
250 67.13±6.69 −20.02 7.60±0.55
400 54.73±8.73 2.15 6.80±1.09
Positive control Chloroquine 5 4.54±2.09* 91.89 13.60±0.89*
Negative control Tween 80 0.2 mL 55.9±36.62 0.00 7.60±0.55
Stem bark H O 100 64.66±5.65 −5.43 9.20±1.64
2
250 57.28±7.39 6.61 8.80±2.05
400 62.34±2.43 −1.63 10.20±1.10
Positive control Chloroquine 5 5.77±1.64* 90.59 15.00±3.32*
Negative control Distilled H O 0.2 mL 61.33±6.27 0.00 9.80±1.64
2
Stem bark Organic 100 35.50±7.87 1.66 10.0±1.87
250 56.65±7.95 −56.93 9.0±1.87
400 51.97±8.81 −43.95 10.00±2.45
Positive control Chloroquine 5 5.12±4.73* 85.83 13.75±1.89*
Negative control Tween 80 0.2 mL 36.10±16.83 0.00 8.80±2.05
Notes: *Indicates significant difference from control, P≤0.05. Chemosuppression: ≥60%, high activity; 30 – 60%, moderate activity; <30%, weak
activity; 0%, inactivity .
[13]
Table 5. In vivo curative antimalarial activity of the aqueous and organic extracts of Tithonia diversifolia in Plasmodium
berghei‑infected mice
Plant part Extract Dose (mg/kg) Parasite density (%) Chemosuppression (%) Mean survival time (days)
Leaves H O 100 52.39±3.67 23.44 10.25±2.06
2
250 57.80±0.74 15.53 10.50±1.73
400 39.06±5.60* 42.91 13.00±4.24
Positive control Chloroquine 5 2.65±1.24* 96.12 14.67±1.15
Negative control Distilled H O 0.2 mL 68.43±12.14 0.00 9.50±1.73
2
Leaves Organic 100 28.41±7.84* 66.13 7.33±0.58
250 68.80±13.89 17.98 8.25±1.89
400 N/A N/A 7.25±0.5
Positive control Chloroquine 5 3.03±2.58* 96.39 14.00±2.45*
Negative control Tween 80 0.2 mL 83.88±0.52 0.00 7.40±0.55
Notes: *Indicates significant difference from control, P≤0.05. Chemosuppression: ≥60%, high activity; 30 – 60%, moderate activity; <30%, weak
activity; 0%, inactivity .
[13]
although the differences were not statistically significant decreased on D8. The MST of the M. lucida-treated mice
(P > 0.05) (Table 8). Unlike the DCM-MeOH (1:1) extract in this experiment ranged from 10.00 ± 0.82 to 12.50 ±
groups, which showed no activity at any dose levels, the 1.73 days, when the positive and negative control groups
aqueous extract of M. lucida stem bark exhibited moderate had MST between 10.75 ± 0.96 to 12.50 ± 2.38 days and
activity at all dose levels on D . However, the activity 10.50 ± 1.00 to 11.25 ± 1.89 days, respectively (Table 8).
6
Volume 6 Issue 2 (2023) 8 https://doi.org/10.36922/itps.0300