
Page 77 - MSAM-3-4
P. 77
Materials Science in Additive Manufacturing Impact resistance and porous structures
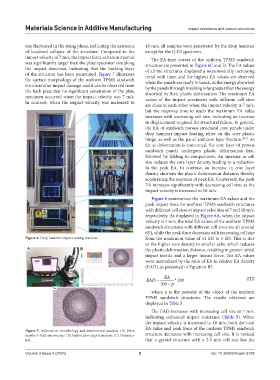
size fluctuated in the rising phase, indicating the existence 10 m/s, all samples were penetrated by the drop hammer
of localized collapse of the structure. Compared to the except for the G-E2 specimen.
impact velocity of 7 m/s, the impact force variation interval The EA-time curves of the uniform TPMS sandwich
was significantly larger than the plate specimen size along structure are presented in Figure 6C and D. The EA values
the impact direction, indicating that the backing layer of all the structures displayed a monotonically increasing
of the structure has been penetrated. Figure 7 illustrates trend with time, and the highest EA values are observed
the surface morphology of the uniform TPMS sandwich when the panels are ready to break, as the energy absorbed
structure after impact damage, and it can be observed from by the panels through breaking is far greater than the energy
the back plate that no significant penetration of the plate absorbed by their plastic deformation. The maximum EA
specimen occurred when the impact velocity was 7 m/s. values of the impact specimens with different cell sizes
In contrast, when the impact velocity was increased to
are close to each other when the impact velocity is 7 m/s,
but the response time to reach the maximum EA value
increases with increasing cell size, indicating an increase
in displacement required for structural failure. In general,
the EA of sandwich porous structural core panels under
drop hammer impact loading relies on the core plastic
hinge, as well as the panel and core layer fracture. 40,41 As
far as deformation is concerned, the core layer of porous
sandwich panels undergoes plastic deformation first,
followed by folding to compactness. An increase in cell
size reduces the core layer density, leading to a reduction
in the peak EA. In contrast, an increase in core layer
density shortens the plastic deformation distance, thereby
accelerating the response of peak EA. Conversely, the peak
EA increases significantly with decreasing cell size, as the
impact velocity is increased to 10 m/s.
Figure 8 summarizes the maximum EA values and the
peak impact force for uniform TPMS sandwich structures
with different cell sizes at impact velocities of 7 and 10 m/s,
respectively. As displayed in Figure 8A, when the impact
velocity is 7 m/s, the total EA values of the uniform TPMS
sandwich structures with different cell sizes are all around
65 J, while the peak force decreases with increasing cell size
Figure 4. Drop hammer impact testing machine from the maximum value of 11 kN to 5 kN. This is due
to the higher core density in smaller cells, which reduces
A B the plastic deformation distance, resulting in greater initial
impact inertia and a larger impact force. The EA values
were normalized by the ratio of EA to relative EA density
(EAD), as presented in Equation III:
EA
EAD = *100 (III)
100 − p
C
where p is the porosity of the object of the uniform
TPMS sandwich structures. The results obtained are
displayed in Table 5.
The EAD increases with increasing cell size at 7 m/s,
indicating enhanced impact resistance (Table 5). When
the impact velocity is increased to 10 m/s, both the total
EA value and peak force of the uniform TPMS sandwich
Figure 5. Indentation morphology and dimensional analysis. (A) Ultra
depth-of-field microscope. (B) Indentation depth analysis. (C) Diameter structure decreases with increasing cell size. It is noticed
test that a gyroid structure with a 2.5 mm cell size has the
Volume 3 Issue 4 (2024) 5 doi: 10.36922/msam.5729