
Page 78 - MSAM-3-4
P. 78
Materials Science in Additive Manufacturing Impact resistance and porous structures
A B
C D
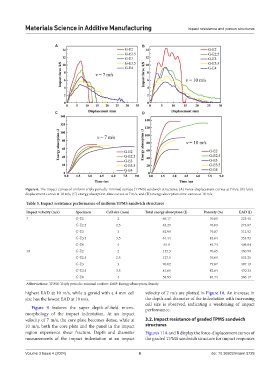
Figure 6. The impact curves of uniform triply periodic minimal surface (TPMS) sandwich structures: (A) Force-displacement curves at 7 m/s, (B) force-
displacement curves at 10 m/s, (C) energy absorption-time curves at 7 m/s, and (D) energy absorption-time curves at 10 m/s
Table 5. Impact resistance performance of uniform TPMS sandwich structures
Impact velocity (m/s) Specimen Cell size (mm) Total energy absorption (J) Porosity (%) EAD (J)
7 G-E2 2 66.17 70.65 225.45
G-E2.5 2.5 65.29 76.09 273.07
G-E3 3 62.99 79.87 312.92
G-E3.5 3.5 61.44 82.64 353.92
G-E4 4 61.9 84.74 405.64
10 G-E2 2 135.3 70.65 460.99
G-E2.5 2.5 127.5 76.09 533.25
G-E3 3 90.02 79.87 447.19
G-E3.5 3.5 81.65 82.64 470.33
G-E4 4 58.93 84.74 386.17
Abbreviations: TPMS: Triply periodic minimal surface; EAD: Energy absorption density.
highest EAD at 10 m/s, while a gyroid with a 4 mm cell velocity of 7 m/s are plotted in Figure 10. An increase in
size has the lowest EAD at 10 m/s. the depth and diameter of the indentation with increasing
cell size is observed, indicating a weakening of impact
Figure 9 features the super depth-of-field micro- performance.
morphology of the impact indentation. At an impact
velocity of 7 m/s, the core plate becomes dense, while at 3.2. Impact resistance of graded TPMS sandwich
10 m/s, both the core plate and the panel in the impact structures
region experience shear fracture. Depth and diameter Figures 11A and B display the force-displacement curves of
measurements of the impact indentation at an impact the graded TPMS sandwich structure for impact responses
Volume 3 Issue 4 (2024) 6 doi: 10.36922/msam.5729