
Page 80 - MSAM-3-4
P. 80
Materials Science in Additive Manufacturing Impact resistance and porous structures
Figure 9. Ultra-field microscopic morphology of uniform triply periodic minimal surface (TPMS) sandwich structures after impact damage
A B
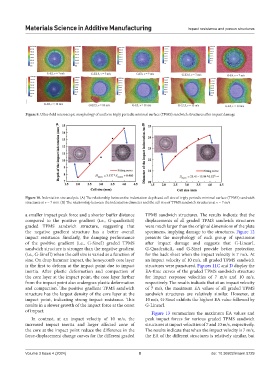
Figure 10. Indentation size analysis. (A) The relationship between the indentation depth and cell size of triply periodic minimal surface (TPMS) sandwich
structures at v = 7 m/s. (B) The relationship between the indentation diameter and the cell size of TPMS sandwich structures at v = 7 m/s
a smaller impact peak force and a shorter buffer distance TPMS sandwich structures. The results indicate that the
compared to the positive gradient (i.e., G-quadraticI) displacements of all graded TPMS sandwich structures
graded TPMS sandwich structure, suggesting that were much larger than the original dimensions of the plate
the negative gradient structure has a better overall specimens, implying damage to the structures. Figure 12
impact resistance. Similarly, the damping performance presents the morphology of each group of specimens
of the positive gradient (i.e., G-SineI) graded TPMS after impact damage and suggests that G-LinearI,
sandwich structure is stronger than the negative gradient G-QuadraticII, and G-SineI provide better protection
(i.e., G-SineII) when the cell size is varied as a function of for the back sheet when the impact velocity is 7 m/s. At
sine. On drop hammer impact, the honeycomb core layer an impact velocity of 10 m/s, all graded TPMS sandwich
is the first to deform at the impact point due to impact structures were punctured. Figures 11C and D display the
inertia. After plastic deformation and compaction of EA-time curves of the graded TPMS sandwich structure
the core layer at the impact point, the core layer farther for impact response velocities of 7 m/s and 10 m/s,
from the impact point also undergoes plastic deformation respectively. The results indicate that at an impact velocity
and compaction. The positive gradient TPMS sandwich of 7 m/s, the maximum EA values of all graded TPMS
structure has the largest density of the core layer at the sandwich structures are relatively similar. However, at
impact point, indicating strong impact resistance. This 10 m/s, G-SineI exhibits the highest EA value followed by
results in a slower growth of the impact force at the onset G-LinearI.
of impact. Figure 13 summarizes the maximum EA values and
In contrast, at an impact velocity of 10 m/s, the peak impact forces for various graded TPMS sandwich
increased impact inertia and larger affected zone of structures at impact velocities of 7 and 10 m/s, respectively.
the core at the impact point reduce the difference in the The results indicate that when the impact velocity is 7 m/s,
force-displacement change curves for the different graded the EA of the different structures is relatively similar, but
Volume 3 Issue 4 (2024) 8 doi: 10.36922/msam.5729