
Page 92 - MSAM-4-1
P. 92
Materials Science in Additive Manufacturing Additive manufacturing of NASA HR-1 angled walls
polishing with a 0.1 µm fumed silica pad. Force was lowered 2.6. Fractography
from 30 N to 20 N during final polishing until a mirror- Fracture surfaces on each sample were observed under
like surface was achieved. Both grinding and polishing JSM-IT500 SEM (Jeol, Japan). The working distance was
processes were performed using a Saphir 530 machine adjusted between 23 and 35 mm to evaluate and identify
(QATM, Germany). Grain sizes were measured using the the fracture mechanism of all samples, allowing for
intercept method according to ASTM E-112 to determine comparisons to determine whether they exhibited similar
19
the average grain size within each sample’s microstructure.
or differing behaviors during fracture. Sample preparation
2.5. Mechanical testing included the application of conductive tape to ensure
electrical contact between the metal piece and the mount.
Four tensile dog bone samples were extracted from each
heat-treated wall and subjected to tensile testing using an 2.7. Statistical analysis
Instron 1,125 machine (Instron, USA) with a 100 kN frame A t-test was performed to assess whether the results from
according to ASTM E8-2. The tests were conducted until tensile and fatigue testing exhibited significant differences,
20
fracture to obtain the UTS, 0.2% offset YS, elongation, with P < 0.05 considered significant. Statistical analysis was
and reduction area. LCF was performed according to performed using Minitab software (version 22.1.0). 23
ASTM E606-21. using three machined dog bone samples
21
also obtained from the angled walls. The LCF tests were 3. Results and discussion
conducted under fully reversal tensile-compressive
conditions (R = −1) at a frequency of 0.5 Hz and strain 3.1. Powder characterization
range of 1% on a GLC DXF machine (Instron, USA) The powder exhibited an average Hall flow rate (FR ) of
with a 100 kN frame. Microhardness measurements were 23.1 s/g and an apparent density of 1.10 g/cm . The D10,
H
3
taken using Qness CHD master hardness tester (QATM, D50, and D90 values were measured at 57 µm, 74 µm,
Germany), which involved five indentations along each and 95 µm, respectively. The PSD is shown in Figure 3.
sample in the XY plane, following ASTM E2546. 22
Furthermore, the spherical morphology and dendritic
texture of the powder are shown in Figure 4.
Table 2. Heat treatment cycle for NASA HR‑1 consisting of
stress relief, homogenization, solution annealing, and aging In addition, Figure 5 displays the cross-section of the
powder in both polished and etched conditions. In both
Heat treatment Temperature (°F)/duration (hours)
states, gas porosity entrapment is evident in some particles,
Stress relief 1,065°C/1.5 with an average diameter of 7.85 µm, as indicated by the
Homogenization 1,162°C/6 arrows (Figure 5). This porosity can affect the defect content
Solution annealing treatment 1,065°C/1 of the deposited beads. In the etched condition, a dendritic
Two-step aging 690°C/16 and 621°C/16 microstructure with very well-defined grain boundaries is
observable in all particles, illustrating how these particles
solidified during the rotary atomized process.
Table 3. Chemical composition of NASA HR‑1 alloy powder
3.2. Defect content or density
Chemical Fe Ni Cr Co Mo Ti Al V W
Percentage by Bal 34.04 14.68 3.77 1.87 2.4 0.25 0.30 1.62 The percentage of porosity was measured and compared in
weight (Wt%) the XY plane for different power settings and deposition
Abbreviation: Bal: Balance; NASA: National Aeronautics and Space angles of the AM-angled walls. All samples exhibited
Administration. small voids that can be classified as gas porosity based
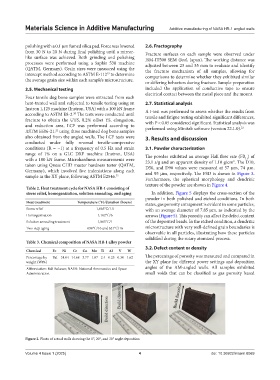
Figure 2. Photo of actual walls showing the 0°, 20°, and 30° angle deposition
Volume 4 Issue 1 (2025) 4 doi: 10.36922/msam.8069