
Page 96 - MSAM-4-1
P. 96
Materials Science in Additive Manufacturing Additive manufacturing of NASA HR-1 angled walls
Figure 13. Tensile curves of laser powder direct energy deposition heat-treated samples printed with different deposition angles or laser power
when compared to the 0° sample. However, this difference A
was not found when compared to the 30° sample.
This suggests that the statistical difference observed is
insufficient to conclude that YS is being affected at this
deposition angle, as other evidence does not support
this statement. Figure 13 shows one tensile curve for
each sample, illustrating their mechanical performance
characteristics.
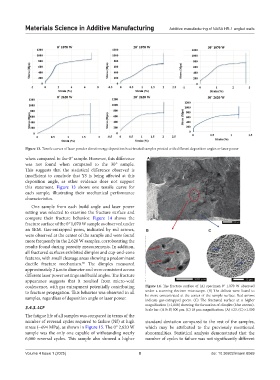
One sample from each build angle and laser power
setting was selected to examine the fracture surface and
compare their fracture behavior. Figure 14 shows the
fracture surface of the 0° 1,070 W sample as observed under
an SEM. Gas-entrapped pores, indicated by red arrows, B C
were observed at the center of the sample and were found
more frequently in the 2,620 W samples, corroborating the
results found during porosity measurements. In addition,
all fractured surfaces exhibited dimples and cup-and-cone
features, with small cleavage areas showing a predominant
ductile fracture mechanism. The dimples measured
30
approximately 2 µm in diameter and were consistent across
different laser power settings and build angles. The fracture
appearance suggests that it resulted from micro-void
coalescence, with gas entrapment potentially contributing Figure 14. The fracture surface of (A) specimen 0° 1,070 W observed
to fracture propagation. This behavior was observed in all under a scanning electron microscope. (B) The defects were found to
be more concentrated at the center of the sample surface. Red arrows
samples, regardless of deposition angle or laser power. indicate gas-entrapped pores. (C) The fractured surface at a higher
magnification (×1,000) showing the formation of dimples (blue arrows).
3.4.3. LCF Scale bar: (A & B) 500 µm, (C) 10 µm; magnification: (A) ×23, (C) ×1,000
The fatigue life of all samples was compared in terms of the
number of reversal cycles required to failure (Nf) at high standard deviation compared to the rest of the samples,
stress (~694 MPa), as shown in Figure 15. The 0° 2,620 W which may be attributed to the previously mentioned
sample was the only one capable of withstanding nearly abnormalities. Statistical analysis demonstrated that the
6,000 reversal cycles. This sample also showed a higher number of cycles to failure was not significantly different
Volume 4 Issue 1 (2025) 8 doi: 10.36922/msam.8069