
Page 93 - MSAM-4-1
P. 93
Materials Science in Additive Manufacturing Additive manufacturing of NASA HR-1 angled walls
Figure 3. Graphical representation of powder particle size distribution
A B Table 4. Comparison of porosity percentage on laser powder
direct energy deposition NASA HR‑1 angled walls
Sample Porosity %
0° 1,070 W 0.08
0° 2,620 W 0.21
20° 1,070 W 0.07
20° 2,620 W 0.20
30° 1,070 W 0.01
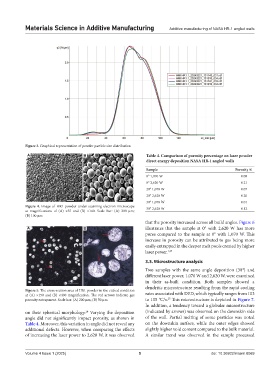
Figure 4. Image of HR1 powder under scanning electron microscope 30° 2,620 W 0.12
at magnifications of (A) ×55 and (B) ×140. Scale bar: (A) 200 µm;
(B) 100 µm
that the porosity increased across all build angles. Figure 6
A B illustrates that the sample at 0° with 2,620 W has more
pores compared to the sample at 0° with 1,070 W. This
increase in porosity can be attributed to gas being more
easily entrapped in the deeper melt pools created by higher
laser power. 1,24
3.3. Microstructure analysis
Two samples with the same angle deposition (30°) and
different laser power, 1,070 W and 2,620 W, were examined
in their as-built condition. Both samples showed a
dendritic microstructure resulting from the rapid cooling
Figure 5. The cross-section area of HR1 powder in the etched condition
at (A) ×150 and (B) ×400 magnification. The red arrows indicate gas rates associated with DED, which typically ranges from 103
25
porosity entrapment. Scale bar: (A) 200 µm; (B) 50 µm to 105 °C/s. This microstructure is depicted in Figure 7.
In addition, a tendency toward a globular microstructure
on their spherical morphology. Varying the deposition (indicated by arrows) was observed on the downskin side
24
angle did not significantly impact porosity, as shown in of the wall. Partial melting of some particles was noted
Table 4. Moreover, this variation in angle did not reveal any on the downskin surface, while the outer edges showed
additional defects. However, when comparing the effects slightly higher void content compared to the bulk material.
of increasing the laser power to 2,620 W, it was observed A similar trend was observed in the sample processed
Volume 4 Issue 1 (2025) 5 doi: 10.36922/msam.8069