
Page 95 - MSAM-4-1
P. 95
Materials Science in Additive Manufacturing Additive manufacturing of NASA HR-1 angled walls
A B C
Figure 9. Samples were printed at (A) 0°, (B) 20°, and (C) 30° deposition angles. Scale bar: 200 µm; magnification: ×100
A
B
Figure 10. Distribution of carbides. (A) Sample 0° 1,070W shows the
distribution of carbides within the γ matrix and (B) γ’ precipitates found in
literature. Red arrows indicate γ’ precipitates under optical microscope.
1
Yellow arrows also indicate γ’ under scanning electron microscope. Scale
bar: (A) 20 µm, (B) 100 µm; magnification: ×500
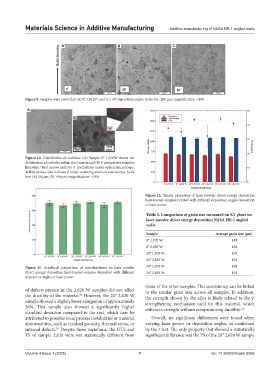
Figure 12. Tensile properties of laser powder direct energy deposition
heat-treated samples printed with different deposition angles deposition
or laser power
Table 5. Comparison of grain size measured on XY plane on
laser powder direct energy deposition NASA HR‑1 angled
walls
Sample Average grain size (µm)
0° 1,070 W 189
0° 2,620 W 182
20° 1,070 W 195
20° 2,620 W 194
Figure 11. Graphical comparison of microhardness on laser powder 30° 1,070 W 188
direct energy deposition heat-treated samples deposited with different 30° 2,620 W 193
deposition angles or laser power.
those of the other samples. This consistency can be linked
of defects present in the 2,620 W samples did not affect to the similar grain size across all samples. In addition,
the ductility of the material. However, the 20° 2,620 W the strength shown by the alloy is likely related to the γ’
28
sample showed a slightly lower elongation of approximately strengthening mechanism used for this material, which
30%. This sample also showed a significantly higher enhances strength without compromising ductility. 1,2
standard deviation compared to the rest, which may be
attributed to possible local process instabilities or material Overall, no significant differences were found when
abnormalities, such as residual porosity, thermal stress, or varying laser power or deposition angles, as confirmed
internal defects. Despite these variations, the UTS and by the t-test. The only property that showed a statistically
29
YS of sample 2,620 were not statistically different from significant difference was the YS of the 20° 2,620 W sample
Volume 4 Issue 1 (2025) 7 doi: 10.36922/msam.8069