
Page 94 - MSAM-4-1
P. 94
Materials Science in Additive Manufacturing Additive manufacturing of NASA HR-1 angled walls
A B A B
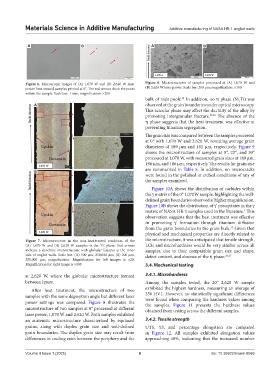
Figure 6. Microscopic images of (A) 1,070 W and (B) 2,620 W laser Figure 8. Microstructures of samples processed at (A) 1,070 W and
power heat-treated samples printed at 0°. The red arrows show the pores (B) 2,620 W laser power. Scale bar: 200 µm; magnification: ×100
within the sample. Scale bar: 1 mm, magnification: ×200
bulk of melt pools. In addition, no η phase (Ni Ti) was
25
3
A observed at the grain boundaries under optical microscopy.
This acicular phase may affect the ductility of the alloy by
promoting intergranular fracture. 25,26 The absence of the
η phase suggests that the heat treatment was effective at
preventing titanium segregation.
The grain size was compared between the samples processed
at 0° with 1,070 W and 2,620 W, revealing average grain
diameters of 189 µm and 181 µm, respectively. Figure 9
shows the microstructure of samples at 0°, 20°, and 30°
processed at 1,070 W, with measured grain sizes at 189 µm,
196 µm, and 186 µm, respectively. The results for grain size
are summarized in Table 5. In addition, no microcracks
B
were found in the polished or etched conditions of any of
the samples examined.
Figure 10A shows the distribution of carbides within
the γ matrix of the 0° 1,070W sample, highlighting the well-
defined grain boundaries observed at higher magnification.
Figure 10B shows the distribution of γ’ precipitates in the γ
matrix of NASA HR-1 samples used in the literature. This
1
observation suggests that the heat treatment was effective
in promoting γ’ formation through titanium diffusion
15
from the grain boundaries to the grain bulk. Given that
physical and mechanical properties are directly related to
Figure 7. Microstructure in the non-heat-treated condition of the the microstructure, it was anticipated that tensile strength,
(A) 1,070 W and (B) 2,620 W samples in the YZ plane. Red arrows LCF, and microhardness would be very similar across all
indicate a dendritic microstructure with globular features at the inner samples, due to their comparable grain size and shape,
side of angled walls. Scale bar: (A) 500 µm, 250,000 µm; (B) 200 µm, defect content, and absence of the η phase. 26,27
250,000 µm; magnification: Magnification for left images is ×20.
Magnification for right image is ×100 3.4. Mechanical testing
at 2,620 W, where the globular microstructure formed 3.4.1. Microhardness
between layers. Among the samples tested, the 20° 2,620 W sample
After heat treatment, the microstructure of two exhibited the highest hardness, measuring an average of
samples with the same deposition angle but different laser 356 HV1. However, no statistically significant differences
power settings was compared. Figure 8 illustrates the were found when comparing the hardness values among
the samples. Figure 11 presents the hardness values
microstructure of two samples at 0° processed at different obtained from testing across the different samples.
laser power, 1,070 W and 2,620 W. Both samples exhibited
an austenitic microstructure characterized by equiaxed 3.4.2. Tensile strength
grains, along with duplex grain size and well-defined UTS, YS, and percentage elongation are compared
grain boundaries. The duplex grain size may result from in Figure 12. All samples exhibited elongation values
differences in cooling rates between the periphery and the approaching 40%, indicating that the increased number
Volume 4 Issue 1 (2025) 6 doi: 10.36922/msam.8069