
Page 61 - AIH-1-4
P. 61
Artificial Intelligence in Health A fuzzy system for heartbeat classification
defined as abnormal beats. In Figure 13, the sub-figures are
depicted with different markings to show the performance
clearly. Blue circular shows the actual data, however, they
are covered by classified data. Red cross points represent
the classified data (accurate or inaccurate) before applying
the variable thresholds. At the same time, black star points
demonstrate checking classification after implementing
the variable threshold. From Figure 13, it is concluded
that the application of the threshold in the NSR and RBBB
systems is insignificant because they are accurate enough
due to their distinguished characteristics. The LBBB and
PVC beats are similar in terms of some characteristics, so
it is demanding for the ANFIS to distinguish these beats
100% accurately thus, the accuracy of classification is
somewhat lower than other beats; this fact is more obvious
in PVC beat classification, and it can be seen in simulation
Figure 10. Step size curve of NSR for the proposed VTMA (illustration results. The APC classification is done efficiently, and
by the authors) applying variable threshold plays a prominent role in
Abbreviations: NSR: Normal sinus rhythm; VTMA: Variable-threshold the classification of these kinds of beats. In PB beats, the
multi-adaptive neuro-fuzzy system. effective role of applying threshold is illustrated, and there
is no irregularity in classification. As a result, PVC, APC,
LBBB, and PB classification have improved dramatically
and these changes convey the meaning of the strong impact
of putting a variable threshold on the six ANFIS outputs.
The effectiveness of classification is assessed using
performance parameters such as accuracy, sensitivity
(recall), specificity, precision, and F -score (dice), which
1
are represented by Equations XXIV–XXVIII, respectively.
Heart rate serves as a proxy for true positive (TP), true
negative (TN), false positive (FP), and false negative (FN)
in all five measurements.
TP TN+
Accuracy % () = ×100 % (XXIV)
TP TN FP FN+ + +
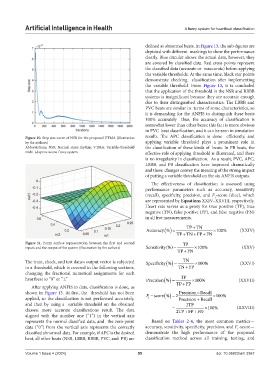
Figure 11. Fuzzy surface representation between the first and second TP
inputs and the output of the system (illustration by the authors) Sensitivity%() = ×100 % (XXV)
TP FN+
The train, check, and test data›s output vector is subjected Specificity% () = TN ×100 % (XXVI)
to a threshold, which is covered in the following sections, TN FP+
changing the fractional numerical assignments for each
heartbeat to “0” or “1.” Precision% () = TP ×100 % (XXVII)
After applying ANFIS to data, classification is done, as TP FP+
×
shown in Figure 13. At first, the threshold has not been PrecisionRecall
() =
applied, so the classification is not performed accurately, F −score% 2 PrecisionRecall × 100%
+
1
and then by using a variable threshold on the obtained 2TP
classes, more accurate classifications result. The data = 2TP FFP FN+ ×100 % (XXVIII)
+
aligned with the number one (“1”) in the vertical axis
represents the normal classified data, and the zero-point Based on Tables 2-4, the most common metrics—
data (“0”) from the vertical axis represents the correctly accuracy, sensitivity, specificity, precision, and F -score—
1
classified abnormal data. For example, if APC is the desired demonstrate the high performance of the proposed
beat, all other beats (NSR, LBBB, RBBB, PVC, and PB) are classification method across all training, testing, and
Volume 1 Issue 4 (2024) 55 doi: 10.36922/aih.3367