
Page 108 - ESAM-1-2
P. 108
Engineering Science in
Additive Manufacturing HIP temperature effects on LPBF Hastelloy X
(A ) (B ) (C ) (D )
1 1 1 1
(A ) (B ) (C ) (D )
2 2 2 2
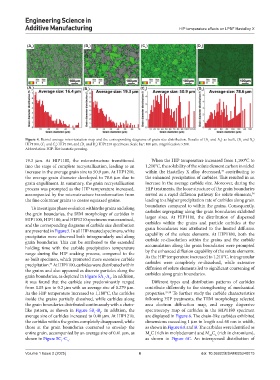
Figure 4. Kernel average misorientation map and the corresponding diagrams of grain size distribution. Results of (A and A ) as built, (B and B )
2
1
1
2
HIP1100, (C and C ) HIP1180, and (D and D ) HIP1210 specimens. Scale bar: 100 μm, magnification: ×500.
1
2
1
2
Abbreviation: HIP: Hot isostatic pressing.
19.3 μm. At HIP1180, the microstructure transitioned When the HIP temperature increased from 1,100°C to
into the stage of complete recrystallization, leading to an 1,210°C, the solubility of the solute element carbon in nickel
increase in the average grain size to 50.9 μm. At HIP1210, within the Hastelloy X alloy decreased, contributing to
35
the average grain diameter developed to 78.6 μm due to the enhanced precipitation of carbides. This resulted in an
grain engulfment. In summary, the grain recrystallization increase in the average carbide size. Moreover, during the
process was prompted as the HIP temperature increased, HIP treatments, the loose structure of the grain boundaries
accompanied by the microstructure transformation from served as a rapid diffusion pathway for solute elements,
36
the fine columnar grains to coarse equiaxed grains. leading to a higher precipitation rate of carbides along grain
To investigate phase evolution within the grains and along boundaries compared to within the grains. Consequently,
the grain boundaries, the SEM morphology of carbides in carbides segregating along the grain boundaries exhibited
HIP1100, HIP1180, and HIP1210 specimens was examined, larger sizes. At HIP1100, the distribution of dispersed
and the corresponding diagrams of carbide size distribution carbides within the grains and particle carbides at the
are presented in Figure 5. In all HIP-treated specimens, white grain boundaries was attributed to the limited diffusion
precipitates were observed both intragranularly and along capability of the solute elements. At HIP1180, both the
grain boundaries. This can be attributed to the extended carbide re-dissolution within the grains and the carbide
holding time with the carbide precipitation temperature accumulation along the grain boundaries were prompted
range during the HIP soaking process, compared to the by the enhanced diffusion capability of the solute elements.
as-built specimen, which promoted more extensive carbide As the HIP temperature increased to 1,210°C, intragranular
precipitation. At HIP1100, carbides were distributed within carbides were completely re-dissolved, while extensive
34
the grains and also appeared as discrete particles along the diffusion of solute elements led to significant coarsening of
grain boundaries, as depicted in Figure 5A -A . In addition, carbides along grain boundaries.
1
4
it was found that the carbide size predominantly ranged Different types and distribution patterns of carbides
from 0.05 μm to 0.2 μm with an average size of 0.279 μm. contribute differently to the strengthening of mechanical
As the HIP temperature increased to 1,180°C, the carbides properties. 37,38 To further study the carbide characteristics
inside the grains partially dissolved, while carbides along following HIP treatments, the TEM morphology, selected
the grain boundaries distributed continuously with a chain- area electron diffraction map, and energy dispersive
like pattern, as shown in Figure 5B -B . In addition, the spectroscopy map of carbides in the HIP1180 specimen
4
1
average size of carbides increased to 0.40 μm. At HIP1210, are displayed in Figure 6. The chain-like carbides exhibited
the carbides within the grains completely disappeared, while dimensions exceeding 1 μm in length and 60 nm in width,
those at the grain boundaries coarsened to envelop the as shown in Figure 6A and B. The carbides were identified as
entire grain, accompanied by an average size of 0.41 μm, as M C (rich in molybdenum) and M C (rich in chromium),
6
6
23
shown in Figure 5C -C . as shown in Figure 6C. An interspersed distribution of
1
4
Volume 1 Issue 2 (2025) 6 doi: 10.36922/ESAM025240015