
Page 133 - GHES-2-4
P. 133
Global Health Economics and
Sustainability
Fiscal policy shocks and health outcomes
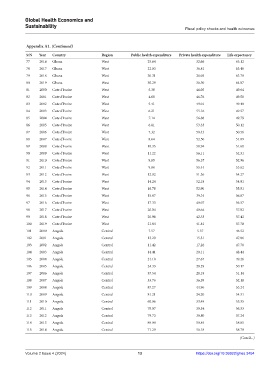
Appendix A1. (Continued)
S/N Year Country Region Public health expenditure Private health expenditure Life expectancy
77 2016 Ghana West 25.64 32.66 63.12
78 2017 Ghana West 22.03 36.81 63.46
79 2018 Ghana West 30.31 38.05 63.78
80 2019 Ghana West 30.29 36.50 64.07
81 2000 Cote d’Ivoire West 5.30 46.05 49.64
82 2001 Cote d’Ivoire West 4.68 46.76 49.50
83 2002 Cote d’Ivoire West 5.41 49.01 49.48
84 2003 Cote d’Ivoire West 6.21 55.16 49.57
85 2004 Cote d’Ivoire West 7.14 56.88 49.79
86 2005 Cote d’Ivoire West 6.81 53.33 50.12
87 2006 Cote d’Ivoire West 7.32 50.43 50.56
88 2007 Cote d’Ivoire West 8.64 52.50 51.09
89 2008 Cote d’Ivoire West 10.35 58.94 51.68
90 2009 Cote d’Ivoire West 11.22 56.11 52.31
91 2010 Cote d’Ivoire West 9.85 56.37 52.96
92 2011 Cote d’Ivoire West 9.80 55.44 53.62
93 2012 Cote d’Ivoire West 12.82 51.36 54.27
94 2013 Cote d’Ivoire West 14.24 52.18 54.91
95 2014 Cote d’Ivoire West 16.78 52.90 55.51
96 2015 Cote d’Ivoire West 15.87 39.34 56.07
97 2016 Cote d’Ivoire West 17.33 40.07 56.57
98 2017 Cote d’Ivoire West 20.04 40.64 57.02
99 2018 Cote d’Ivoire West 20.98 42.33 57.42
100 2019 Cote d’Ivoire West 21.84 41.81 57.78
101 2000 Angola Central 7.57 5.37 46.52
102 2001 Angola Central 13.20 15.31 47.06
103 2002 Angola Central 11.42 17.26 47.70
104 2003 Angola Central 14.41 20.11 48.44
105 2004 Angola Central 21.18 27.67 49.26
106 2005 Angola Central 24.33 28.29 50.17
107 2006 Angola Central 37.54 28.18 51.14
108 2007 Angola Central 53.76 36.59 52.18
109 2008 Angola Central 87.27 44.96 53.24
110 2009 Angola Central 81.21 34.20 54.31
111 2010 Angola Central 60.06 33.49 55.35
112 2011 Angola Central 79.07 39.54 56.33
113 2012 Angola Central 79.73 39.80 57.24
114 2013 Angola Central 89.08 50.84 58.05
115 2014 Angola Central 71.29 56.18 58.78
(Cont’d...)
Volume 2 Issue 4 (2024) 13 https://doi.org/10.36922/ghes.3454