
Page 156 - GPD-4-1
P. 156
Gene & Protein in Disease FXR1 modulates gene expression in cancer
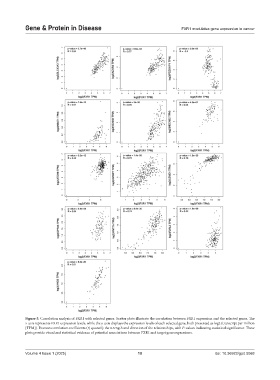
Figure 5. Correlation analysis of FXR1 with selected genes. Scatter plots illustrate the correlation between FXR1 expression and the selected genes. The
x-axis represents FXR1 expression levels, while the y-axis displays the expression levels of each selected gene, both presented as log2 (transcript per million
[TPM]). Pearson correlation coefficients (r) quantify the strength and direction of the relationships, with P-values indicating statistical significance. These
plots provide visual and statistical evidence of potential associations between FXR1 and target gene expressions.
Volume 4 Issue 1 (2025) 10 doi: 10.36922/gpd.5068