
Page 157 - GPD-4-1
P. 157
Gene & Protein in Disease FXR1 modulates gene expression in cancer
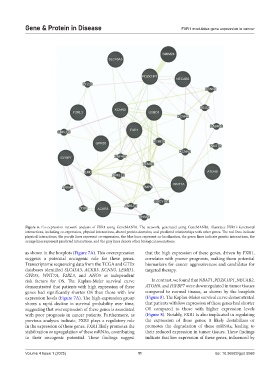
Figure 6. Co-expression network analysis of FXR1 using GeneMANIA. The network, generated using GeneMANIA, illustrates FXR1’s functional
interactions, including co-expression, physical interactions, shared protein domains, and predicted relationships with other genes. The red lines indicate
physical interactions, the purple lines represent co-expression, the blue lines represent co-localization, the green lines indicate genetic interactions, the
orange lines represent predicted interactions, and the gray lines denote other biological associations.
as shown in the boxplots (Figure 7A). This overexpression that the high expression of these genes, driven by FXR1,
suggests a potential oncogenic role for these genes. correlates with poorer prognosis, making them potential
Transcriptome sequencing data from the TCGA and GTEx biomarkers for cancer aggressiveness and candidates for
databases identified SLC43A3, ACKR3, KCNN3, LEMD1, targeted therapy.
GPR35, WNT7A, F2RL3, and ANO5 as independent
risk factors for OS. The Kaplan-Meier survival curve In contrast, we found that NBAT1, PDZK1IP1, NECAB2,
demonstrated that patients with high expression of these ATOH8, and IGFBP7 were downregulated in tumor tissues
genes had significantly shorter OS than those with low compared to normal tissues, as shown by the boxplots
expression levels (Figure 7A). The high-expression group (Figure 8). The Kaplan-Meier survival curve demonstrated
shows a rapid decline in survival probability over time, that patients with low expression of these genes had shorter
suggesting that overexpression of these genes is associated OS compared to those with higher expression levels
with poor prognosis in cancer patients. Furthermore, as (Figure 8). Notably, FXR1 is also implicated in regulating
previous analyses indicate, FXR1 plays a regulatory role the expression of these genes; it likely destabilizes or
in the expression of these genes. FXR1 likely promotes the promotes the degradation of these mRNAs, leading to
stabilization or upregulation of these mRNAs, contributing their reduced expression in tumor tissues. These findings
to their oncogenic potential. These findings suggest indicate that low expression of these genes, influenced by
Volume 4 Issue 1 (2025) 11 doi: 10.36922/gpd.5068