
Page 67 - IJAMD-2-1
P. 67
International Journal of AI for
Materials and Design
Fatigue life prediction via contrastive learning
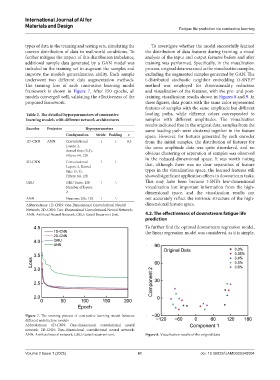
types of data in the training and testing sets, simulating the To investigate whether the model successfully learned
uneven distribution of data in real-world conditions. To the distribution of data features during training, a visual
further mitigate the impact of this distribution imbalance, analysis of the input and output features before and after
additional sample data generated by a GAN model was training was performed. Specifically, in the visualization
included in the training set to augment the samples and process, original data was used as the visualization samples,
improve the model’s generalization ability. Each sample excluding the augmented samples generated by GAN. The
underwent two different data augmentation methods. t-distributed stochastic neighbor embedding (t-SNE)
68
The training loss of each contrastive learning model method was employed for dimensionality reduction
framework is shown in Figure 7. After 150 epochs, all and visualization of the features, with the pre- and post-
models converged well, validating the effectiveness of the training visualization results shown in Figures 8 and 9. In
proposed framework. these figures, data points with the same color represented
features of samples with the same amplitude but different
Table 2. The detailed hyperparameters of contrastive loading paths, while different colors corresponded to
learning models with different network architectures samples with different amplitudes. The visualization
results indicated that in the original data, samples from the
Encoder Projector Hyperparameters same loading path were clustered together in the feature
Configuration Stride Padding τ space. However, for features generated by each encoder
1D-CNN ANN Convolutional 1 1 0.3 from the initial samples, the distribution of features for
Layers: 2, the same amplitude data was quite disordered, and no
Kernel Size: (3,3), obvious clustering or separation of samples was observed
Filters: 64, 128
2D-CNN Convolutional 1 1 in the reduced-dimensional space. It was worth noting
that, although there was no clear separation of feature
Layers: 2, Kernel
Size: (3, 3), types in the visualization space, the learned features still
Filters: 64, 128 showed significant application effects in downstream tasks.
GRU GRU Units: 128 \ \ This may have been because t-SNE’s low-dimensional
Number of layers: visualization lost important information from the high-
2 dimensional space, and the visualization results can
ANN Neurons: 256, 128 \ \ not accurately reflect the intrinsic structure of the high-
Abbreviations: 1D-CNN: One-Dimensional Convolutional Neural dimensional feature space.
Network; 2D-CNN: Two-Dimensional Convolutional Neural Network;
ANN: Artificial Neural Network; GRU: Gated Recurrent Unit. 4.2. The effectiveness of downstream fatigue life
prediction
To further find the optimal downstream regression model,
the linear regression model was considered, as it is simple,
Figure 7. The training process of contrastive learning model between
different architecture models
Abbreviations: 1D-CNN: One-dimensional convolutional neural
network; 2D-CNN: Two-dimensional convolutional neural network;
ANN: Artificial neural network; GRU: Gated recurrent unit. Figure 8. Visualization results of the original data
Volume 2 Issue 1 (2025) 61 doi: 10.36922/IJAMD025040004