
Page 68 - IJAMD-2-1
P. 68
International Journal of AI for
Materials and Design
Fatigue life prediction via contrastive learning
A B
C D
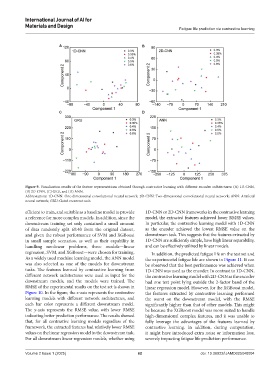
Figure 9. Visualization results of the feature representations obtained through contrastive learning with different encoder architectures: (A) 1D-CNN,
(B) 2D-CNN, (C) GRU, and (D) ANN.
Abbreviations: 1D-CNN: One-dimensional convolutional neural network; 2D-CNN: Two-dimensional convolutional neural network; ANN: Artificial
neural network; GRU: Gated recurrent unit.
efficient to train, and suitable as a baseline model to provide 1D-CNN or 2D-CNN frameworks in the contrastive learning
a reference for more complex models. In addition, since the model, the extracted features achieved lower RMSE values.
downstream training set only contained a small amount In particular, the contrastive learning model with 1D-CNN
of data randomly split 60:40 from the original dataset, as the encoder achieved the lowest RMSE value on the
and given the robust performance of SVM and XGBoost downstream task. This suggests that the features extracted by
in small sample scenarios, as well as their capability in 1D-CNN are sufficiently simple, have high linear separability,
handling nonlinear problems, three models—linear and can be effectively utilized by linear models.
regression, SVM, and XGBoost—were chosen for training. In addition, the predicted fatigue life on the test set and
As a widely used machine learning model, the ANN model the experimental fatigue life are shown in Figure 11. It can
was also selected as one of the models for downstream be observed that the best performance was achieved when
tasks. The features learned by contrastive learning from 1D-CNN was used as the encoder. In contrast to 1D-CNN,
different network architectures were used as input for the the contrastive learning model with 2D-CNN as the encoder
downstream models, and the models were trained. The had one test point lying outside the 2-factor band of the
RMSE of the experimental results on the test set is shown in linear regression model. However, for the XGBoost model,
Figure 10. In the figure, the x-axis represents the contrastive the features extracted by contrastive learning performed
learning models with different network architectures, and the worst on the downstream model, with the RMSE
each bar color represents a different downstream model. significantly higher than that of other models. This might
The y-axis represents the RMSE value, with lower RMSE be because the XGBoost model was more suited to handle
indicating better prediction performance. The results showed high-dimensional complex features, and it was unable to
that, for all contrastive learning models regardless of the fully leverage the advantages of the features learned by
framework, the extracted features had relatively lower RMSE contrastive learning. In addition, during computation,
values on the linear regression model in the downstream task. it might have introduced extra noise or information loss,
For all downstream linear regression models, whether using severely impacting fatigue life prediction performance.
Volume 2 Issue 1 (2025) 62 doi: 10.36922/IJAMD025040004