
Page 417 - IJB-10-1
P. 417
International Journal of Bioprinting Osteogenic differentiation of hMSCs by PBF-LB
for both tests. The sample sizes for cell analysis and single- 3.3. Gene expression analysis by single-cell
cell RNA sequencing were 5 and 3, respectively. RNA sequencing
Stemness properties of the cultured hMSCs were analyzed
3. Results by the comparison of CD90, CD44, and SH2 expression
3.1. Surface topography of the 3D-printed analysis. The expression of CD90, a known stem cell marker
Ti-6Al-4V surface of MSC, was significantly decreased in MSCs cultured on
The 3D profile of each metal-printed substrate surface was 100 µm substrate, as well as the decreasing tendency in
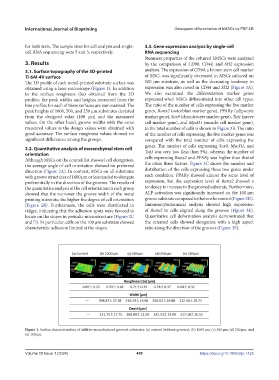
obtained using a laser microscope (Figure 1). In addition expression was also noted in CD44 and SH2 (Figure 3A).
to the surface roughness (Sa) obtained from the 3D We also examined the differentiation marker genes
profiles, the peak widths and heights measured from the expressed when MSCs differentiated into other cell types.
line profiles for each of these surfaces are summarized. The The ratio of the number of cells expressing the five marker
peak heights of 1000, 500, and 250 µm substrates deviated genes, Runx2 (osteoblast marker gene), PPARγ (adipocyte
from the designed value (100 µm) and the measured marker gene), Sox9 (chondrocyte marker gene), Tuj1 (nerve
values. On the other hand, groove widths with the same cell marker gene), and MyoD1 (muscle cell marker gene),
measured values as the design values were obtained with to the total number of cells is shown in Figure 3B. The ratio
good accuracy. The surface roughness values showed no of the number of cells expressing the five marker genes was
significant differences among the groups. compared with the total number of cells expressing the
genes. The number of cells expressing Sox9, MyoD1, and
3.2. Quantitative analysis of mesenchymal stem cell
orientation Tuj1 was very low (less than 5%), whereas the number of
Although MSCs on the control flat showed cell elongation, cells expressing Runx2 and PPARγ was higher than that of
the average angle of cell orientation showed no preferred the other three factors. Figure 3C shows the number and
direction (Figure 2A). In contrast, MSCs on all substrates distribution of the cells expressing these two genes under
with groove structures of 1000 µm or less tended to elongate each condition. PPARγ showed almost the same level of
preferentially in the direction of the grooves. The results of expression, but the expression level of Runx2 showed a
the quantitative analysis of the cell orientation in each group tendency to increase in the grooved substrate. Furthermore,
showed that the narrower the groove width of the metal ALP activation was significantly increased on the 100 µm
printing substrate, the higher the degree of cell orientation groove substrate compared to that on the control (Figure 3D).
(Figure 2B). Furthermore, the cells were distributed in Immunocytochemical analysis showed high expression
ridges, indicating that the adhesion spots were favored to of Runx2 in cells aligned along the grooves (Figure 3E).
locate on the slopes in periodic microstructure (Figure 2C Quantitative cell deformation analysis demonstrated that
and D). In particular, cells on the 100 µm substrate showed the oriented cells showed elongation with a high aspect
characteristic adhesion limited at the slopes. ratio along the direction of the grooves (Figure 3F).
Figure 1. Surface characterization of additive-manufactured grooved substrates: (a) control (without grooves), (b) 1000 μm, (c) 500 μm, (d) 250 μm, and
(e) 100 μm.
Volume 10 Issue 1 (2024) 409 https://doi.org/10.18063/ijb.1425