
Page 560 - IJB-10-2
P. 560
International Journal of Bioprinting OLS design for distal femur osseointegration
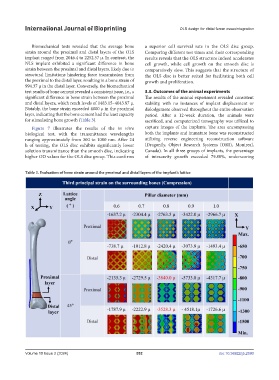
Biomechanical tests revealed that the average bone a superior cell survival rate in the OLS disc group.
strain around the proximal and distal layers of the OLS Comparing different test times and their corresponding
implant ranged from 2046.4 to 2252.57 μ. In contrast, the results reveals that the OLS structure indeed accelerates
NLS implant exhibited a significant difference in bone cell growth, while cell growth on the smooth disc is
strain between the proximal and distal layers, likely due to comparatively slow. This suggests that the structure of
structural limitations hindering force transmission from the OLS disc is better suited for facilitating both cell
the proximal to the distal layer, resulting in a bone strain of growth and proliferation.
994.37 μ in the distal layer. Conversely, the biomechanical
test results of bone cement revealed a consistent issue, i.e., a 3.3. Outcomes of the animal experiments
significant difference in bone strain between the proximal The results of the animal experiment revealed consistent
and distal layers, which reach levels of 1483.15–4043.87 μ. stability, with no instances of implant displacement or
Notably, the bone strain exceeded 4000 μ in the proximal dislodgement observed throughout the entire observation
layer, indicating that the bone cement had the least capacity period. After a 12-week duration, the animals were
for stimulating bone growth (Table 3). sacrificed, and computerized tomography was utilized to
Figure 7 illustrates the results of the in vitro capture images of the implants. The area encompassing
biological test, with the transmittance wavelengths both the implants and immature bone was reconstructed
ranging approximately from 300 to 1000 nm. After 24 utilizing reverse engineering reconstruction software
h of testing, the OLS disc exhibits significantly lower (Dragonfly, Object Research Systems (ORS), Montreal,
solution transmittance than the smooth disc, indicating Canada). In all three groups of implants, the percentage
higher OD values for the OLS disc group. This confirms of intracavity growth exceeded 79.80%, underscoring
Table 2. Evaluation of bone strain around the proximal and distal layers of the implant’s lattice
Volume 10 Issue 2 (2024) 552 doi: 10.36922/ijb.2590