
Page 26 - IJB-10-4
P. 26
International Journal of Bioprinting PAI for 3D bioprinted constructs
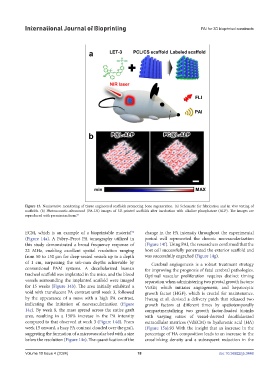
Figure 13. Noninvasive monitoring of tissue engineered scaffolds promoting bone regeneration. (a) Schematic for fabrication and in vivo testing of
scaffolds. (b) Photoacoustic-ultrasound (PA-US) images of 3D-printed scaffolds after incubation with alkaline phosphatase (ALP). The images are
reproduced with permission from. 86
ECM, which is an example of a bioprintable material change in the PA intensity throughout the experimental
92
(Figure 14a). A Fabry–Perot PA tomography utilized in period well represented the chronic neovascularization
this study demonstrated a broad frequency response of (Figure 14f). Using PAI, the researchers confirmed that the
22 MHz, enabling excellent spatial resolution ranging host cell successfully penetrated the exterior scaffold and
from 50 to 150 μm for deep-seated vessels up to a depth was successfully engrafted (Figure 14g).
of 1 cm, surpassing the sub-mm depths achievable by Cerebral angiogenesis is a robust treatment strategy
conventional PAM systems. A decellularized human for improving the prognosis of fatal cerebral pathologies.
tracheal scaffold was implanted in the mice, and the blood Optimal vascular proliferation requires distinct timing
vessels surrounding the implanted scaffold were imaged separation when administering two pivotal growth factors:
for 15 weeks (Figure 14b). The area initially exhibited a VEGF, which initiates angiogenesis, and hepatocytic
void with translucent PA contrast until week 3, followed growth factor (HGF), which is crucial for maintenance.
by the appearance of a mass with a high PA contrast, Hwang et al. devised a delivery patch that released two
indicating the initiation of neovascularization (Figure growth factors at different times by spatiotemporally
14c). By week 8, the mass spread across the entire graft compartmentalizing two growth factor-loaded bioinks
area, resulting in a 150% increase in the PA intensity with varying ratios of vessel-derived decellularized
compared to that observed at week 3 (Figure 14d). From extracellular matrices (VdECM) to hyaluronic acid (HA)
week 15 onward, a hazy PA contrast clouded over the graft, (Figure 15a).93 With the insight that an increase in the
suggesting the formation of a microvascular bed with a size percentage of HA composition leads to an increase in the
below the resolution (Figure 14e). The quantification of the crosslinking density and a subsequent reduction in the
Volume 10 Issue 4 (2024) 18 doi: 10.36922/ijb.3448