
Page 68 - IJB-8-3
P. 68
Extrusion of two-vasculature scaffold for angiogenesis
A
B C
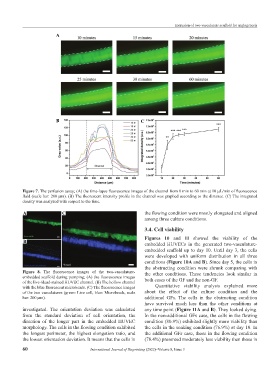
Figure 7. The perfusion assay; (A) the time-lapse fluorescence images of the channel from 0 min to 60 min at 10 µL/min of fluorescence
fluid (scale bar: 200 µm). (B) The fluorescent intensity profile in the channel was graphed according to the distance. (C) The integrated
density was analyzed with respect to the time.
A C the flowing condition were mostly elongated and aligned
among three culture conditions.
3.4. Cell viability
Figures 10 and 11 showed the viability of the
B
embedded HUVECs in the generated two-vasculature-
embedded scaffold up to day 10. Until day 3, the cells
were developed with uniform distribution in all three
conditions (Figure 10A and B). Since day 5, the cells in
the obstructing condition were shrunk comparing with
Figure 8. The fluorescence images of the two-vasculature- the other conditions. These tendencies look similar in
embedded scaffold during pumping; (A) the fluorescence images
of the live-/dead-stained HUVEC channel. (B) The hollow channel both cases of the GF and the non-GF.
with the blue fluorescent microbeads. (C) The fluorescence images Quantitative viability analysis explained more
of the two vasculatures (green: Live cell, blue: Microbeads, scale about the effect of the culture condition and the
bar: 200 µm). additional GFs. The cells in the obstructing condition
have survived much less than the other conditions at
investigated. The orientation deviation was calculated any time point (Figure 11A and B). They looked dying.
from the standard deviation of cell orientation, the In the non-additional GFs case, the cells in the flowing
direction of the longer part in the embedded HUVEC condition (80.9%) exhibited slightly more viability than
morphology. The cells in the flowing condition exhibited the cells in the soaking condition (76.9%) at day 10. In
the longest perimeter, the highest elongation ratio, and the additional GFs case, those in the flowing condition
the lowest orientation deviation. It means that the cells in (78.4%) presented moderately less viability than those in
60 International Journal of Bioprinting (2022)–Volume 8, Issue 3