
Page 189 - IJB-9-6
P. 189
International Journal of Bioprinting 3D-printed assembly anatomical patella fracture bone plate
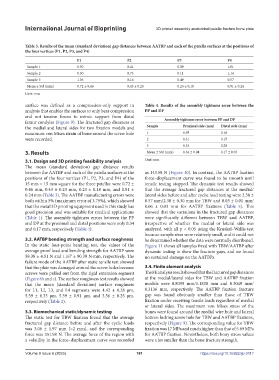
Table 3. Results of the mean (standard deviation) gap distances between AATBP and each of the patella surfaces at the positions of
the four vertices (P1, P2, P3, and P4)
P1 P2 P3 P4
Sample 1 0.50 0.41 0.09 1.01
Sample 2 0.30 0.73 0.11 1.14
Sample 3 1.36 0.16 0.49 0.57
Mean ± Std (mm) 0.72 ± 0.46 0.43 ± 0.23 0.23 ± 0.18 0.91 ± 0.24
Unit: mm
surface was defined as a compression-only support in Table 4. Results of the assembly tightness error between the
analysis that enables the surfaces to only bear compression PP and DP
and not tension forces to mimic support from distal Assembly tightness error between PP and DP
femur condyles (Figure 9). The fractured gap distances at
the medial and lateral sides for two fixation models and Sample Proximal side (mm) Distal side (mm)
maximum von Mises strain of bone around the screw hole 1 0.39 0.16
were recorded. 2 0.31 0.15
3 0.33 0.20
3. Results Mean ± Std (mm) 0.34 ± 0.04 0.17 ± 0.03
3.1. Design and 3D printing feasibility analysis Unit: mm
The mean (standard deviation) gap distance results
between the AATBP and each of the patella surfaces at the as 143.58 N (Figure 10). In contrast, the AATBP fixation
positions of the four vertices (P1, P2, P3, and P4) of the force–displacement curve was found to be smooth until
15 mm × 15 mm square for the three patellae were 0.72 ± tensile testing stopped. The dynamic test results showed
0.46 mm, 0.43 ± 0.23 mm, 0.23 ± 0.18 mm, and 0.91 ± that the average fractured gap distances at the medial/
0.24 mm (Table 3). The AATBP manufacturing errors were lateral sides before and after cyclic load testing were 2.38 ±
both within 5% (maximum error of 3.75%), which showed 0.57 mm/2.30 ± 0.30 mm for TBW and 0.03 ± 0.01 mm/
that the metal 3D printing equipment used in this study has 0.06 ± 0.03 mm for AATBP fixations (Table 5). This
good precision and was suitable for medical applications showed that the variations in the fractured gap distances
(Table 1). The assembly tightness errors between the PP were significantly different between TBW and AATBP,
and DP at the proximal and distal positions were only 0.34 irrespective of whether the medial or lateral side was
and 0.17 mm, respectively (Table 4). analyzed, with all p < 0.05 using the Kruskal–Wallis test
because sample sizes were relatively small, and it could not
3.2. AATBP bending strength and surface roughness be determined whether the data were normally distributed.
In the static four-point bending test, the values of the Figure 11 shows all samples fixed with TBW/AATBP after
average proof load and bending strength for AATBP were dynamic testing to show the fracture gaps, and we found
58.38 ± 4.51 N and 1167 ± 90.39 N·mm, respectively. The no sustained damage on the AATBPs.
failure mode of the AATBP after static tensile test showed
that the plate was damaged around the screw holes because 3.4. Finite element analysis
screws were pulled out from the rigid extension segment The FE analysis result showed that the fractured gap distances
(Figure 6b and c). The surface roughness test results showed at the medial/lateral sides for TBW and AATBP fixation
that the mean (standard deviation) surface roughness models were 0.8099 mm/1.1838 mm and 0.3049 mm/
for L1, L2, L3, and L4 segments were 4.42 ± 0.28 µm, 0.3136 mm, respectively. The AATBP fixation fracture
5.59 ± 0.33 µm, 5.39 ± 0.91 µm, and 3.56 ± 0.25 µm, gap was found obviously smaller than those of TBW
respectively (Table 2). fixation under receiving tensile loads regardless of medial
or lateral sides. The maximum von Mises stress of the
3.3. Biomechanical static/dynamic testing bones were found around the medial wire hole and lateral
The static test for TBW fixation found that the average bottom locking screw hole for TBW and AATBP fixations,
fractured gap distance before and after the cyclic loads respectively (Figure 9). The corresponding value for TBW
was 3.06 ± 1.97 mm (>2 mm), and the corresponding fixation was 17 MPa and much higher than that of 5.69 MPa
force was 351.98 N. The average force of the region with for AATBP fixation. Nevertheless, both bony stress values
a volatility in the force–displacement curve was recorded were a lot smaller than the bone fracture strength.
Volume 9 Issue 6 (2023) 181 https://doi.org/10.36922/ijb.0117