
Page 168 - IJOCTA-15-2
P. 168
A modified graphical based tuning and performance analysis of second order LADRC . . .
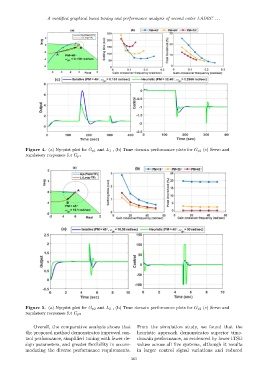
Figure 4. (a) Nyquist plot for G p1 and L 1 , (b) Time domain performance plots for G p1 (c) Servo and
regulatory responses for G p1
Figure 5. (a) Nyquist plot for G p2 and L 2 , (b) Time domain performance plots for G p2 (c) Servo and
regulatory responses for G p2
Overall, the comparative analysis shows that From the simulation study, we found that the
the proposed method demonstrates improved con- heuristic approach demonstrates superior time-
trol performance, simplified tuning with fewer de- domain performance, as evidenced by lower ITSE
sign parameters, and greater flexibility in accom- values across all five systems, although it results
modating the diverse performance requirements. in larger control signal variations and reduced
363