
Page 65 - MSAM-1-1
P. 65
Materials Science in Additive Manufacturing Thixotropic metal 3D printing
a material. It is assumed that the alloy would remain stable simulation as a function of time over a period of time. The
within the reservoir. The heating source was defined to cover simulation was adjusted to reach a steady state on a time scale
a specific boundary region of the reservoir. The geometry of approximately 30 min that is comparable to the observed
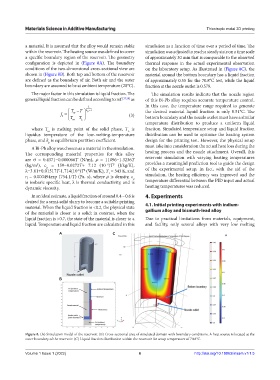
configuration is depicted in (Figure 8A). The boundary thermal response in the actual experimental observation
conditions of the two-dimensional cross-sectional view are on the laboratory setup. As illustrated in (Figure 8C), the
shown in (Figure 8B). Both top and bottom of the reservoir material around the bottom boundary has a liquid fraction
are defined as the boundary of air. Both air and the outer of approximately 0.55 for the 70.8°C test, while the liquid
boundary are assumed to be at ambient temperature (20°C). fraction at the nozzle outlet is 0.579.
The major factor in this simulation is liquid fraction. The The simulation results indicate that the nozzle region
general liquid fraction can be defined according to ref. [17,18] as of this Bi-Pb alloy requires accurate temperature control.
1 In this case, the temperature range required to generate
−T T p k −1 the desired material liquid fraction is only 0.51°C. The
f 1 = m (3)
T m −T L bottom boundary and the nozzle outlet must have a similar
temperature distribution to produce a uniform liquid
where T is melting point of the solid phase, T is fraction. Simulated temperature setup and liquid fraction
m
L
liquidus temperature of the low-melting-temperature distribution can be used to optimize the heating system
phase, and k is equilibrium partition coefficient. design for the printing test. However, the physical setup
p
A Bi-Pb alloy was chosen as a material in the simulation. must take into consideration the actual heat loss during the
The corresponding material properties for this alloy heating process and the nozzle attachment. Overall, this
are σ = 0.4371−0.000066T (N/m), = 11096−1.3236T reservoir simulation with varying heating temperatures
−6
3
(kg/m ), c = 159−0.0272T+ 7.12 (10 )T (J/kg/K), provides a meaningful prediction tool to guide the design
2
λ=3.61+0.01517T-1.714(10 )T (W/m/K), T = 343 K, and of the experimental setup. In fact, with the aid of the
2
-6
1
η = 0.000494exp (754.1/T) (Pa. s), where is density, c simulation, the heating efficiency was improved and the
is isobaric specific heat, λ is thermal conductivity, and is temperature differential between the PID input and actual
dynamic viscosity. heating temperatures was reduced.
In an ideal estimate, a liquid fraction of around 0.4 – 0.6 is 4. Experiments
desired for a semi-solid slurry to become a suitable printing 4.1. Initial printing experiments with indium-
material. When the liquid fraction is <0.2, the physical state
of the material is closer to a solid; in contrast, when the gallium alloy and bismuth-lead alloy
liquid fraction is >0.7, the state of the material is closer to a Due to practical limitations from materials, equipment,
liquid. Temperature and liquid fraction are calculated in this and facility, only several alloys with very low melting
A C
B
Figure 8. (A) Simulation model of the reservoir. (B) Cross-sectional area of simulated domain with boundary conditions. A heat source is located at the
outer boundary of the reservoir. (C) Liquid fraction distribution within the reservoir for setup temperature of 70.8°C.
Volume 1 Issue 1 (2022) 6 http://doi.org/10.18063/msam.v1i1.5