
Page 11 - MSAM-1-2
P. 11
Materials Science in Additive Manufacturing Flexural behavior of bio-inspired sutures
44 mm, and 4 mm, with a span length of 100 mm. The It is worth mentioning that the material anisotropy and
test setup without and with a PLA specimen is given in localized defects that occur due to the 3D printing process
Figure 3G and H. The crosshead displacement rate was are not considered in this analytical model. Through
maintained to be 1 mm/min, and a 1 N preload was applied displacement boundary conditions, loading was applied
to ensure proper contact between the test specimen and to the top roller, while two bottom supporting rollers
the impactor. Five specimens were tested for each design. were encastered. Hard contact formulation was utilized to
The centered cylindrical roller with 10 mm diameter and create normal contact behavior between the rollers and the
two supporting rollers at the bottom with 10 mm diameter test specimens, and tangential behavior was defined using
were utilized to perform the three-point bending test. penalty friction formulation with a friction coefficient
of 0.3. A two-dimensional model was developed to save
2.3. DIC
the cost and time of the simulation for S1, S2, S3, S3-2°,
DIC was conducted using Ncorr open source 2D Matlab S3-5°, and S3-8° with 38029 linear quadrilateral elements
software to analyze the strain field generation during the of type CPS4R. The load of the top roller was further
[51]
flexural test . The region of interest (ROI) for the DIC analyzed, and the bending stiffness of each specimen is
was carefully selected to obtain the maximum results. As calculated by the slope of the linear part of the force-
the specimen was built by connecting two parts, during displacement curve.
three-point bending, the two parts started to separate, and
creating a gap between the parts; hence, to eliminate the 3. Results and discussion
negative impact on the DIC results, selecting the ROI was 3.1. Experimental results
done separately for the two parts.
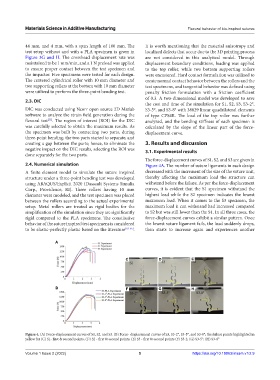
The force-displacement curves of S1, S2, and S3 are given in
2.4. Numerical simulation Figure 4A. The number of suture ligaments in each design
A finite element model to simulate the suture inspired decreased with the increment of the size of the suture unit,
structure under a three-point bending test was developed thereby affecting the maximum load the structure can
using ABAQUS/Explicit 2020 (Dassault Systems Simulia withstand before the failure. As per the force-displacement
Corp., Providence, RI). Three rollers having 10 mm curves, it is evident that the S1 specimen withstand the
diameter were modeled, and the test specimen was placed highest load while the S2 specimen indicates the lowest
between the rollers according to the actual experimental maximum load. When it comes to the S3 specimen, the
setup. Metal rollers are treated as rigid bodies for the maximum load it can withstand had increased compared
simplification of the simulation since they are significantly to S2 but was still lower than the S1. In all three cases, the
rigid compared to the PLA specimens. The constitutive force-displacement curves exhibit a similar pattern. Once
behavior of the suture inspired test specimens is considered the lowest suture ligament fails, the load suddenly drops,
to be elastic-perfectly plastic based on the literature [52-55] . then starts to increase again and experiences another
A
C D E
B F G H
Figure 4. (A) Force-displacement curves of S1, S2, and S3. (B) Force- displacement curves of S3, S3-2°, S3-5°, and S3-8°; the failure points highlighted in
yellow for (C) S1- first & second points, (D) S2 - first & second points, (E) S3 - first & second points (F) S3-2, (G) S3-5°, (H) S3-8°
Volume 1 Issue 2 (2022) 5 https://doi.org/10.18063/msam.v1i2.9