
Page 14 - MSAM-1-2
P. 14
Materials Science in Additive Manufacturing Flexural behavior of bio-inspired sutures
A
B
C
D
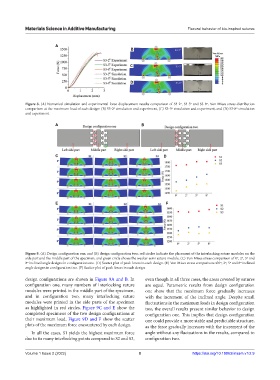
Figure 8. (A) Numerical simulation and experimental force-displacement results comparison of S3-2º, S3-5º and S3-8º. Von Mises stress distribution
comparison at the maximum load of each design: (B) S3-2º simulation and experiment, (C) S3-5º simulation and experiment, and (D) S3-8º simulation
and experiment.
A B
C D
E F
Figure 9. (A) Design configuration one, and (B) design configuration two; red circles indicate the placement of the interlocking suture modules on the
side part and the middle part of the specimen, and green circle shows the weaker semi suture module. (C) Von Mises stress comparison of 0º, 2º, 5º and
8º inclined angle designs in configuration one. (D) Scatter plot of peak forces in each design. (E) Von Mises stress comparison of 0º, 2º, 5º and 8º inclined
angle designs in configuration two. (F) Scatter plot of peak forces in each design.
design configurations are shown in Figure 9A and B. In even though in all three cases, the areas covered by sutures
configuration one, many numbers of interlocking suture are equal. Parametric results from design configuration
modules were printed in the middle part of the specimen, one show that the maximum force gradually increases
and in configuration two, many interlocking suture with the increment of the inclined angle. Despite small
modules were printed in the side parts of the specimen fluctuations in the maximum loads in design configuration
as highlighted in red circles. Figure 9C and E show the two, the overall results present similar behavior to design
completed specimens of the two design configurations at configuration one. This implies that design configuration
their maximum load. Figure 9D and F show the scatter one could provide a more stable and predictable structure,
plots of the maximum force encountered by each design. as the force gradually increases with the increment of the
In all the cases, S1 yields the highest maximum force angle without any fluctuations in the results, compared to
due to its many interlocking points compared to S2 and S3, configuration two.
Volume 1 Issue 2 (2022) 8 https://doi.org/10.18063/msam.v1i2.9