
Page 12 - MSAM-1-2
P. 12
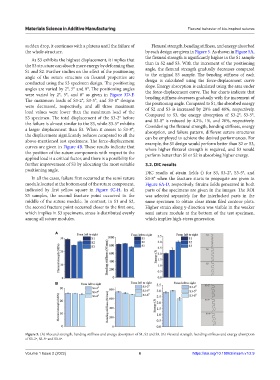
Materials Science in Additive Manufacturing                          Flexural behavior of bio-inspired sutures


            sudden drop, it continues with a plateau until the failure of   Flexural strength, bending stiffness, and energy absorbed
            the whole structure.                               by each design are given in Figure 5. As shown in Figure 5A,
                                                               the flexural strength is significantly higher in the S1 sample
              As S3 exhibits the highest displacement, it implies that
            the S3 structure can absorb more energy by deforming than   than in S2 and S3. With the increment of the positioning
            S1 and S2. Further studies on the effect of the positioning   angle, the flexural strength gradually decreases compared
            angle of the suture structure on flexural properties are   to  the  original  S3  sample.  The  bending  stiffness  of  each
            conducted using the S3 specimen design. The positioning   design is calculated using the force-displacement curve
                                                               slope. Energy absorption is calculated using the area under
            angles are varied by 2°, 5° and 8°. The positioning angles
            were varied by 2°, 5°, and 8° as given in  Figure  3D-F.   the force-displacement curve. The bar charts indicate that
            The maximum loads of S3-2°, S3-5°, and S3-8° designs   bending stiffness decreases gradually with the increment of
                                                               the positioning angle. Compared to S1, the absorbed energy
            were decreased, respectively, and all three maximum   of S2 and S3 is increased by 20% and 48%, respectively.
            load values were  lower than the maximum load  of the   Compared to S3, the energy absorption of S3-2°, S3-5°,
            S3 specimen. The total displacement of the S3-2° before   and S3-8° is reduced by 4.2%, 1%, and 20%, respectively.
            the failure is almost similar to the S3, while S3-5° exhibits   Considering the flexural strength, bending stiffness, energy
            a larger displacement than S3. When it comes to S3-8°,   absorption, and failure pattern, different suture structures
            the displacement significantly reduces compared to all the   can be employed to achieve the desired performances. For
            above-mentioned test specimens. The force-displacement   example, the S1 design would perform better than S2 or S3,
            curves are given in Figure 4B. These results indicate that   where higher flexural strength is required, and S3 would
            the position of the suture components with respect to the   perform better than S1 or S2 in absorbing higher energy.
            applied load is a critical factor, and there is a possibility for
            further improvement of S3 by allocating the most suitable   3.2. DIC results
            positioning angle.
                                                               DIC results of strain fields () for S3, S3-2°, S3-5°, and
              In all the cases, failure first occurred at the semi suture   S3-8° when the fracture starts to propagate are given in
            module located at the bottom end of the suture component,   Figure 6A-D, respectively. Strains fields generated in both
            indicated by first yellow square in  Figure  4C-H. In all   parts of the specimens are given in the images. The ROI
            S3  samples, the second fracture point occurred in the   was selected separately for the interlocked parts in the
            middle of the suture module. In contrast, in S1 and S2,   same specimen to obtain clear strain filed contour plots.
            the second fracture point occurred closer to the first one,   Higher strain along y-direction was visible in the weaker
            which implies in S3 specimens, stress is distributed evenly   semi suture module at the bottom of the test specimen,
            among all suture modules.                          which implies high-stress generation.


                         A


                         B


            Figure 5. (A) Flexural strength, bending stiffness and energy absorption of S1, S2 and S3. (B) Flexural strength, bending stiffness and energy absorption
            of S3-2º, S3-5º and S3-8º.


            Volume 1 Issue 2 (2022)                         6                      https://doi.org/10.18063/msam.v1i2.9