
Page 13 - MSAM-1-2
P. 13
Materials Science in Additive Manufacturing Flexural behavior of bio-inspired sutures
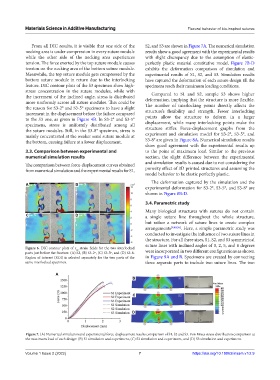
From all DIC results, it is visible that one side of the S2, and S3 are shown in Figure 7A. The numerical simulation
necking area is under compression in every suture module results show a good agreement with the experimental results
while the other side of the necking area experiences with slight discrepancy due to the assumption of elastic-
tension. The force exerted by the top suture module causes perfectly plastic material constitutive model. Figure 7B-D
tension on the necking area of the bottom suture module. exhibits the deformation comparison of simulation and
Meanwhile, the top suture module gets compressed by the experimental results of S1, S2, and S3. Simulation results
bottom suture module in return due to the interlocking have captured the deformation of each suture design till the
feature. DIC contour plots of the S3 specimen show high- specimens reach their maximum loading conditions.
stress concentration in the suture modules, while with Compared to S1 and S2, sample S3 shows higher
the increment of the inclined angle, stress is distributed deformation, implying that the structure is more flexible.
more uniformly across all suture modules. This could be The number of interlocking points directly affects the
the reason for S3-2° and S3-5° specimens to have a slight structure’s flexibility and strength. Fewer interlocking
increment in the displacement before the failure compared
to the S3 one, as given in Figure 4B. In S3-2° and S3-5° points allow the structure to deform in a larger
specimens, stress is uniformly distributed among all displacement, while many interlocking points make the
the suture modules. Still, in the S3-8° specimen, stress is structure stiffer. Force-displacement graphs from the
mainly concentrated at the weaker semi suture module at experiment and simulation model for S3-2°, S3-5°, and
the bottom, causing failure at a lower displacement. S3-8° are given in Figure 8A. Numerical simulation results
show good agreement with the experimental results up
3.3. Comparison between experimental and to the point of maximum load. Similar to the previous
numerical simulation results section, the slight difference between the experimental
The comparison between force-displacement curves obtained and simulation results is caused due to not considering the
from numerical simulation and the experimental results for S1, porosity effect of 3D printed structures and assuming the
model behavior to be elastic perfectly plastic.
The deformation captured by the simulation and the
A B
experimental deformation for S3-2°, S3-5°, and S3-8° are
shown in Figure 8B-D.
3.4. Parametric study
Many biological structures with sutures do not contain
C D a single suture line throughout the whole structure,
but rather a network of suture lines to create complex
arrangements [9,49,56] . Here, a simple parametric study was
conducted to investigate the influence of two suture lines in
the structure. For all three sizes, S1, S2, and S3 symmetrical
suture lines with inclined angles of 0, 2, 5, and 8 degrees
Figure 6. DIC contour plots of ϵ strain fields for the two interlocked
yy
parts just before the fracture. (A) S3, (B) S3-2º, (C) S3-5º, and (D) S3-8. were incorporated in two different configurations as shown
Region of interest (ROI) is selected separately for the two parts of the in Figure 9A and B. Specimens are created by connecting
same interlocked specimen. three separate parts to include two suture lines. The two
A
B
C
D
Figure 7. (A) Numerical simulation and experimental force-displacement results comparison of S1, S2 and S3. Von Mises stress distribution comparison at
the maximum load of each design: (B) S1 simulation and experiment, (C) S2 simulation and experiment, and (D) S3 simulation and experiment.
Volume 1 Issue 2 (2022) 7 https://doi.org/10.18063/msam.v1i2.9