
Page 79 - TD-3-1
P. 79
Tumor Discovery Missense mutations in CXCR1: Impact on stability and function
Table 3. Predicted cancer‑associated CXCR1 mutations for the backbone residues of the native and mutant
using the FATHMM server CXCR1 proteins by comparing them with their original
structures. As displayed in Figure 3A and C, the RMSD
Serial number Mutation Prediction values for the mutant proteins (N57D, R135C, and P302S)
44 R135C Cancer were found to be highly unstable compared to those of the
45 R135L Cancer native protein. While the native protein remained stable
46 R135H Cancer during simulation, the mutant proteins took a longer time
95 N57D Cancer to stabilize. The RMSD values for the mutant proteins
208 P302S Cancer continuously increased from 25 to 45 ns, whereas the
RMSD values for the native CXCR1 remained stable. These
findings indicate that these mutations adversely affected
A protein stability and function. The RMSD for the mutant
CXCR1 was approximately 8 Å (Figure 3C), while that for
the native CXCR1 was approximately 4.4 Å (Figure 3A).
Next, we calculated the RMSF of the Cα atom to
investigate the effect of mutated CXCR1 proteins on
residue dynamics, i.e., protein stability and function. The
RMSF values of the mutant structures were reportedly
greater than those of the native structures, particularly for
B residues located between positions 150 and 200 (7.7 RMSF
Å fluctuation) and between positions 300 and 350 (8 and
11 RMSF Å fluctuation) (Figure 4A and B).
3.8. Protein secondary structure elements
The SSE algorithm was used to investigate the structural
flexibility of CXCR1 proteins. Figure 5 displays the
60
C data on SSEs over time, allowing for a comparison of the
structural changes between the native and mutant CXCR1
proteins. Both the native and mutant forms of the protein
exhibited coils, α-helices, turns, bends, and β-sheets during
the simulation. In contrast, the mutant protein displayed a
significant rise in residues forming α-helices (Figure 5B),
while the native protein exhibited a decrease in both loops
and β-strands forming residues (Figure 5A).
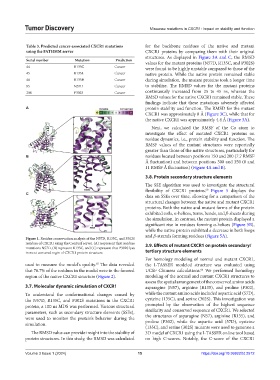
Figure 1. Residue conservation analysis of the N57D, R135C, and P302S
residues of CXCR1 using the ConSurf server. (A) respresent that residues 3.9. Effects of mutant CXCR1 on protein secondary/
mutations N57D, (B) represent R135C, and (C) represent that P302S lyes
in most consered regin of CXCR1 protein structure. tertiary structure elements
For homology modeling of normal and mutant CXCR1,
65
used to measure the model’s quality. The data revealed the I-TASSER modeled structure was evaluated using
that 76.7% of the residues in the model were in the favored UCSF Chimera calculations. We performed homology
66
region of the native CXCR1 structure (Figure 2). modeling of the normal and mutant CXCR1 structures to
assess the spatial arrangement of the conserved amino acids
3.7. Molecular dynamic simulation of CXCR1 asparagine (N57), arginine (R135), and proline (P302),
To understand the conformational changes caused by while the mutant amino acids included aspartic acid (57D),
the N57D, R135C, and P302S mutations in the CXCR1 cysteine (135C), and serine (302S). This investigation was
protein, a 100 ns MDS was performed. Various structural prompted by the observation of the highest sequence
parameters, such as secondary structure elements (SSEs), similarity and conserved sequence of CXCR1. We selected
were used to monitor the protein’s behavior during the the structures of asparagine (N57), arginine (R135), and
simulation. proline (P302), while the aspartic acid (57D), cysteine
(135C), and serine (302S) mutants were used to generate a
The RMSD value can provide insight into the stability of 3D model of CXCR1 using the I-TASSER online tool based
protein structures. In this study, the RMSD was calculated on high C-scores. Notably, the C-score of the CXCR1
Volume 3 Issue 1 (2024) 15 https://doi.org/10.36922/td.2512