
Page 81 - TD-3-1
P. 81
Tumor Discovery Missense mutations in CXCR1: Impact on stability and function
A B
C
D
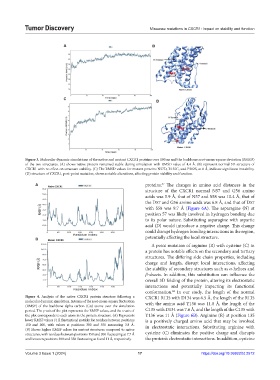
Figure 3. Molecular dynamic simulations of the native and mutant CXCR1 proteins over 100 ns and the backbone root-mean-square deviation (RMSD)
of the two structures. (A) shows native protein remained stable during simulation with RMSD value of 4.4 Å. (B) represent normal 3D structure of
CXCR1 with no effect on structure stability. (C) The RMSD values for mutant proteins N57D, R135C, and P302S, at 8 Å, indicate significant instability.
(D) structure of CXCR1, post-point mutation, shows notable alterations, affecting protein stability and function.
67
A proteins. The changes in amino acid distances in the
structure of the CXCR1 normal N57 and G56 amino
acids was 5.9 Å, that of N57 and S58 was 10.4 Å, that of
the D57 and G56 amino acids was 6.8 Å, and that of D57
with S58 was 9.7 Å (Figure 6A). The asparagine (N) at
position 57 was likely involved in hydrogen bonding due
to its polar nature. Substituting asparagine with aspartic
acid (D) would introduce a negative charge. This change
could disrupt hydrogen bonding interactions in the region,
B potentially affecting the local structure.
A point mutation of arginine (R) with cysteine (C) in
a protein has notable effects on the secondary and tertiary
structures. The differing side chain properties, including
charge and length, disrupt local interactions, affecting
the stability of secondary structures such as α-helices and
β-sheets. In addition, this substitution can influence the
overall 3D folding of the protein, altering its electrostatic
interactions and potentially impacting its functional
conformation. In our study, the length of the normal
68
Figure 4. Analysis of the native CXCR1 protein structure following a CXCR1 R135 with D134 was 6.5 Å, the length of the R135
molecular dynamic simulation. In terms of the root-mean-square fluctuation with the amino acid Y136 was 11.8 Å, the length of the
(RMSF) of the backbone alpha carbon (Cα) atoms over the simulation
period. The y-axis of the plot represents the RMSF values, and the x-axis of C135 with D134 was 7.6 Å, and the length of the C135 with
the plot corresponds to each atom in the protein structure. (A) Represents Y136 was 11 Å (Figure 6B). Arginine (R) at position 135
lower RMSF values (4 Å fluctuation) notably for residues between positions is a positively charged amino acid that may be involved
150 and 200, with values at positions 300 and 350 measuring 3.8 Å. in electrostatic interactions. Substituting arginine with
(B) Shows higher RMSF values for mutant structures compared to native
structures, with residues between positions 150 and 200 fluctuating at 7.7 Å cysteine (C) eliminates the positive charge and disrupts
and between positions 300 and 350 fluctuating at 8 and 11 Å, respectively. the protein’s electrostatic interactions. In addition, cysteine
Volume 3 Issue 1 (2024) 17 https://doi.org/10.36922/td.2512