
Page 54 - IJB-2-2
P. 54
Rheological study on 3D printability of alginate hydrogel and effect of graphene oxide
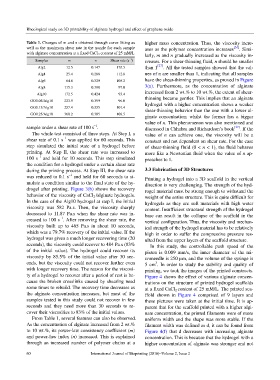
Table 1. Changes of m and n obtained through curve fitting as higher mass concentration. Thus, the viscosity incre-
well as the maximum shear rate in the nozzle for each sample ases as the polymer concentration increases [34] . Simi-
with alginate concentration at a fixed CaCl 2 content of 25 mM/L larly, m and n gradually increased as the viscosity in-
–1
Samples m n Shear rate (s ) creases. For a shear-thinning fluid, n should be smaller
Alg2 12.5 0.147 170.5 than 1 [27] . All the tested samples showed that the val-
Alg4 25.4 0.288 112.8 ues of n are smaller than 1, indicating that all samples
Alg6 64.8 0.329 105.2 have the shear-thinning properties, as proved in Figure
Alg8 115.3 0.390 97.0 3(a). Furthermore, as the concentration of alginate
Alg10 172.5 0.424 93.4 increased from 2 wt.% to 10 wt.%, the extent of shear-
thinning became gentler. This implies that an alginate
GO0.05/Alg10 223.9 0.399 96.0 hydrogel with a higher concentration shows a weaker
GO0.15/Alg10 257.4 0.355 101.4 shear-thinning behavior than the one with a lower al-
GO0.25/Alg10 360.2 0.305 109.5 ginate concentration; whilst the former has a bigger
value of n. This phenomenon was also mentioned and
–1
sample under a shear rate of 100 s . discussed in Chhabra and Richardson’s book [27] . If the
The whole test consisted of three steps. At Step I, a value of n can achieve one, the viscosity will be a
–1
shear rate of 0.1 s was applied for 60 seconds. This constant and not dependent on shear rate. For the case
step simulated the initial state of a hydrogel before of shear-thinning fluid (0 < n < 1), the fluid behaves
printing. At Step II, the shear rate was increased to more like a Newtonian fluid when the value of n ap-
–1
100 s and held for 10 seconds. This step simulated proaches to 1.
the condition for a hydrogel under a certain shear rate
during the printing process. At Step III, the shear rate 3.3 Fabrication of 3D Structures
–1
was reduced to 0.1 s and held for 60 seconds to si- Printing a hydrogel into a 3D scaffold in the vertical
mulate a condition similar to the final state of the hy- direction is very challenging. The strength of the hyd-
drogel after printing. Figure 3(b) shows the recovery rogel material must be strong enough to withstand the
behavior of the viscosity of CaCl 2 /alginate hydrogels. weight of the entire structure. This is quite difficult for
In the case of the Alg10 hydrogel at step I, the initial hydrogels as they are soft materials with high water
viscosity was 582 Pa.s. Then, the viscosity sharply content. Insufficient structural strength of the hydrogel
decreased to 11.87 Pa.s when the shear rate was in- base can result in the collapse of the scaffold in the
–1
creased to 100 s . After removing the shear rate, the vertical configuration. Thus, the viscosity and mechan-
viscosity built up to 465 Pa.s in about 10 seconds, ical strength of the hydrogel material has to be relatively
which was a 79.7% recovery of the initial value. If the high in order to suffer the compressive pressure res-
hydrogel was given a much longer recovering time (20 ulted from the upper layers of the scaffold structure.
seconds), the viscosity could recover to 484 Pa.s (83% In this study, the controllable push speed of the
of the initial value). The hydrogel could recover its piston is 0.009 mm/s, the inner diameter of the mi-
viscosity by 85.5% of the initial value after 30 sec- croneedle is 250 µm, and the volume of the syringe is
onds, but the viscosity could not recover further even 5 cm . In order to study the stability and quality of
3
with longer recovery time. The reason for the viscosi- printing, we took the images of the printed constructs.
ty of a hydrogel to recover after a period of rest is be- Figure 4 shows the effect of various alginate concen-
cause the broken crosslinks caused by shearing need trations on the structure of printed hydrogel scaffolds
some times to rebuild. The recovery time decreases as at a fixed CaCl 2 content of 25 mM/L. The printed sca-
the alginate concentration increases, but most of the ffold shown in Figure 4 comprised of 9 layers and
samples tested in this study could not recover in few these pictures were taken at the initial time. It is ap-
seconds and they need more than 30 seconds to re- parent that for the scaffold printed with a higher algi-
cover their viscosities to 83% of the initial values. nate concentration, the printed filaments were of more
From Table 1, several features can also be observed. uniform width and the shape was more stable. If the
As the concentration of alginate increased from 2 wt.% filament width was defined as d, it can be found from
to 10 wt.%, its power-law consistency coefficient (m) Figure 4(f) that d decreases with increasing alginate
and power-law index (n) increased. This is explained concentration. This is because that the hydrogel with a
through an increased number of polymer chains at a higher concentration of alginate was stronger and not
60 International Journal of Bioprinting (2016)–Volume 2, Issue 2